Showing posts with label small-cap. Show all posts

Friday, 13 February 2015

Reuters Article (Quoted): Some fund managers take a punt on small oil firms


  •     Some fund managers take a punt on small oil firms 
  •     Expect bigger share price rebound with an oil recovery 
  •     Focus on companies like Caza Oil, Bowleven, Soco 

  
    By Atul Prakash 

    LONDON, Feb 13 (Reuters) - After a rout in energy stocks on the back of a slump in crude oil prices, some fund managers have started fishing for smaller oil exploration companies, betting that a price recovery will lead them to outperform. 


    Smaller players, especially oil explorers, look much more attractive on valuation grounds than companies like BP  BP.L  and Royal Dutch Shell  RDSa.L  as their shares have fallen much more than oil majors during the sell-off, they said. 


    These stocks are not without risk -- unlike their more diversified and financially more robust bigger rivals, small  firms are usually less able to offset a slump in oil prices. But investors say the potential rewards look attractive. 


    "I feel relatively confident that we have seen the bottom of the oil price. In such a scenario, high-beta (more volatile) plays like smaller oil explorers and service companies are the first to benefit," said Edmund Shing, global equity fund manager at BCS Asset Management. 

     "At these levels, they also become attractive M&A (takeover) targets as it may be cheaper for big companies to buy exploration firms than find new reserves. If oil prices gain, big players will become more confident, accumulate cash, cut 
capex and look for cheaper reserves." 


    Oil  LCOc1  rose above $60 a barrel on Friday for the first time this year, with prices up more than 30 percent from a multi-year low in mid-January.    


    Shing said that in order to cut some risks, he was investing in firms having low debt and those which had hedged their future output. BCS recently bought Caza Oil & Gas  CAZA.L , Bowleven  BLVN.L , Soco International  SIA.L , Eagle Rock Energy Partners  EROC.O , Memorial Production Partners  MEMP.O  and Emerge Energy Services  EMES.K . 


    Shares in the firms, except Memorial, are up 6 to 34 percent in the first two weeks of this month on a recovery in oil, which has gained 12 percent in February. In contrast oil majors like BP, BG Group and Shell are up 7 percent this month.   


INDISCRIMINATE 

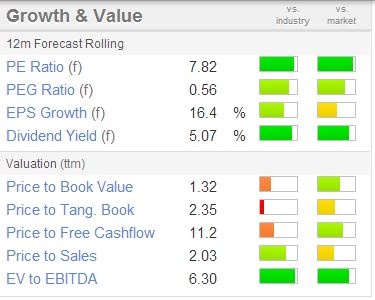
    Thomson Reuters data shows smaller oil firms are cheaper. Memorial trades at 14 times its 12 month forward earnings, while firms like Bowleven have a negative price-to-earnings ratio, against 30 times for BG Group and 20 times for BP. The 12-month price-to-book ratio for smaller oil firms hovers between 0.2 to 0.6, against 1.1-1.6 for large players.   


    "Smaller oil companies were hit by a slump in crude oil prices in an indiscriminate manner, so for some that was an over-reaction. It does make sense at this juncture to start 

looking at them," said Chris Rowland, buy-side energy analyst at investment management company Ecofin. 


    "We like those smaller oil-related names that are operating in cheaper oil basins and are well-hedged, and without pressing near-term debt repayments or covenant tests, which is leading us to look to buy selected U.S. names at this stage." 


    Investment banks are also positive on some smaller oil firms, with Morgan Stanley recently raising its stance on Soco to "equal weight" from "underweight" and Exane BNP Paribas hiking its target price for the company. UBS, which has a "buy" rating for Memorial Production, has increased its target price for the stock to $18 from $15 the stock.  ID:nWNAB05XO6   


    That is not to say that Big Oil is no longer attractive -- after all, majors have fought to protect their dividends by cutting spending -- but investors are looking at different ways to play a potential recovery. 


    "We are still positive on the oil sector, but have become very selective," James Butterfill, global equity strategist at Coutts.   


Tuesday, 25 November 2014

IBT UK: With the Stock Market, the Best Things Do Come in Small Packages


Big is beautiful, so the mantra goes. But not so in the stock market. The very long-term view of stock market performance by size of company, comparing small-caps to large-caps, reveals small-cap companies have in general outperformed the broad market quite substantially.

If you had invested £100 in the UK stock market back at the beginning of 1975, and had diligently re-invested all dividends (ignoring all taxes), then you would have today an investment worth well over £15,000 (Figure 1). Very impressive, you might say to yourself.

Figure 1: Small-Caps Have Done Far, Far Better than Large-Caps


Source: Author, FTSE, Datastream, Hoare Govett

If, however, you had instead invested that £100 in an index of UK small-cap stocks in January 1975 on the same basis, you would now have an investment worth nearly £55,000.

In other words, over the very long-term (nearly 40 years) the small-cap segment of the market has delivered three-and-a-half times the performance of the overall stock market, which is dominated by very well-known stock market giants such as BP, Vodafone and HSBC.

Why would this be the case? The simple explanation is that smaller companies by and large tend to be younger companies with more innovative products or services and which can post faster growth rates, rather than massive companies that are well-established in mature markets with long-running products or services, and which therefore tend to grow at a more sedate pace.

The January small-cap effect

Not only have small-cap stocks done considerably better than large-caps over the long-term in the UK and US, a fact well-documented in the academic financial market literature, but these pint-sized gems have over time performed particularly well at the beginning of the year, the so-called January small-cap effect (Figure 2).

Figure 2: Spot the Small-Cap January Effect! 

Source: Author, FTSE, Datastream, Hoare Govett

While this effect was originally identified in US small-cap stocks, UK small-caps exhibit exactly the same tendency to outperform in January, historically averaging over 4% gains in January since 1975.

In fact, in the UK the first four months of the year have been the best historic period of performance, delivering an average of over 13% from January to April.

Small-caps: One of the few times it is worth using an "active" fund manager


Now in general, I tend to avoid investing using actively managed unit trusts, preferring instead low-cost "passive" index funds and exchange-traded funds for the simple reason that fund managers do not tend to justify their extra cost through better net performance over time.

However, small-cap funds are an exception to this general rule. There are a number of small-cap managers who have demonstrated index-beating performance over time, even after costs.

They manage to cherry-pick a number of high-potential stocks out of a huge universe and then benefit disproportionately from strong long-term performance in these names, while also avoiding a lot of under-performing small-cap "duds".

Figure 3. Strong Performance from Smaller Company ITs Since 2012 

Source: Association of Investment Companies

So, in this case, I would invest in a small-cap fund using one of a small number of investment trusts, which are listed closed-end funds which are run by a stock-picking fund manager.

Funds run by small-cap specialists with long experience and a solid investment process, resulting in a strong performance track record (Figure 3) include:

  1. The Miton Income Fund (LSE code: DIVI), run by small-cap veteran Gervais Williams;
  2. Strategic Equity Capital (LSE code: SEC), a concentrated small-cap fund run by the team at GVO Investment Management;
  3. The Henderson Small-Cap Fund (LSE code: HSL), run by Neil Hermon at Henderson. This trust trades at a 13% discount to net asset value.

Each of these three fund managers have strong long-term track records of investing in UK small-cap stocks and outperforming the small-cap index over time. I particularly like the Miton Fund as it combines small-cap investing with income investing (a 3% dividend yield), aiming for an attractive combination of dividend income and growth from small-cap champions.

Perhaps small is sexy, at least around the new year.

Thursday, 28 August 2014

Blinkx, and You May Miss the Rebound!

53fef1c9dd608blinkx_logo_grey.png   Okay, since I managed to stir up a little controversy with my look at debt management company Fairpoint (LON:FRP) last time around, I thought I would stick with this theme and look at another controversial company, this time Blinkx (LON:BLNX).

What Does Blinkx Do?

The official blurb: 
blinkx is an Internet media company that connects consumers and brands through premium content online. Founded in 2004, blinkx pioneered Internet Video Search using its patented COncept Recognition Engine (CORE). This technology leverages speech recognition, text and image analysis to deeply understand the meaning and context of video content to generate improved search relevancy for consumers and a brand safe environment for advertisers. Through its partnerships with hundreds of media companies, including NBC, Conde Nast, Reuters and Bloomberg, blinkx has indexed and search enabled millions of hours of video content. blinkx powers video search, discovery or monetization on thousands of online properties including Lycos, Discovery Networks, CBS and FoxSports. blinkx is headquartered in San Francisco, California with 15 offices worldwide. 
Or, in the words of the website itself, it is:
A simple way to discover and share great videos.
Still confused as to what they do? Well, here is a link to a video demonstrating how to use the site:

What Is their Business Model?

London/San Francisco-headquartered Blinkx distributes ad-supported content, but has planted its flag firmly in video search and discovery. So it gets a cut of the advertising revenues.

Why has Blinkx Been Under Attack from Short Sellers?

This article on Bloomberg.com highlights a very critical blog post by a Harvard Business School professor, which triggered the stock’s biggest plunge ever.
In the Jan. 28 blog, entitled “The Darker Side of Blinkx", Benjamin Edelman, an associate professor of business administration, said his research indicated that the London-based company used deceptive software to inflate traffic counts and capture commissions. Edelman wrote that he prepared the research for an unnamed client. 
At least 5 hedge fund short sellers have subsequently sold Blinkx short: the investment companies are Luxor Capital Group LP, Blau GmbH, Jericho Capital Asset Management LP, Valiant Capital Management LP and Oxford Asset Management LLP, according to European regulatory filings.

July 2 Profit Warning Underlines Problems at Blinkx

To add grist to the short sellers' mill, at the time of their trading statement on July 2, the company then issued a profit warning for H1 2015, highlighting lower-than-expected demand within their Desktop segment (as people increasingly access the internet via mobile devices rather than desktop PCs), hurting both sales and profits with full-year EBITDA some $5m below management's prior expectations.
The two volume spikes at the time of (a) the publication of the critical blog post at the end of January, and then (b) the profit warning at the beginning of July sent Blinkx's shares down from 217p in mid-January to 32p on July 2. By any stretch of the imagination, this made for an impressive return for anyone shorting the shares!
As a result of all this, one of the biggest investment banking cheerleaders for Blinkx, Goldman Sachs, waved the white flag and cut its analyst rating on Blinkx on July 7 from Buy to Neutral. Goldmans had previously led a Blinkx stock placing of 45.68m shares at 120p at the time of their acquisition of Rhythm NewMedia in June 2013...

So Why Bother with Blinkx Now? 
1. Valuation Is Appealing

Let's look at some simple valuation metrics:
Enterprise Value/Sales is 0.45x for a company that generated a 6.9% operating margin for FY2014:
Note the high net cash element of $126.9m, which highlights the company's solid balance sheet. This seems pretty cheap to me, at least on basic metrics. 
Net free cashflow pre-acquisitions, post investments has been pretty solid too, averaging out at over $29m per year over FY2013 and FY2014, giving a free cash flow yield on enterprise value of 26%!

2. Insider Buying: The CEO Bought at 34p

Interestingly, as a show of faith in the company, the CEO Subhransu Mukherjee bought 250,000 shares at 34p immediately after the profit warning, with insiders now owning 2.11% of the company's shares.. 

3. The Company Now Has Authorisation to Buy Back Shares

Following the July 15 AGM, Blinkx (LON:BLNX) now has authorisation to buy back shares, which would be a better use of some of its net cash position than embarking on more acquisitions... This could at least provide a solid floor for the stock.

4. Change in US-Based Short Positions

According to this latest filing, US-based short positions as of mid-August are down to 5% of what they were at the end of April this year, representing just 0.02% of the outstanding share float.
What is more, major shareholder Blackrock (10.04% of the stock as of July 4) now refuse to lend out their Blinkx shares to short sellers, underlining their commitment to the stock.
BLINKX PLC ("BLNKF-0")
- OTC Short Positions on 2014/08/15      76,540      -2,315      0.52
                                    Net            Total      Last              Total           Price   Date                Change       Shorted     Price        Volume       Range
 2014/08/15       -2,315            76,540     0.52         49,200    0.50 - 0.59
2014/07/31        4,124            78,855     0.57          47,700    0.56 - 0.66
2014/07/15        2,025           74,731     0.63       576,600    0.53 - 1.10
2014/06/30         -838            72,706     1.07       98,100    1.00 - 1.15
2014/06/13       -1,900           73,544        -            46,700    1.06 - 1.19
2014/05/30     -136,672        75,444        -            30,500    1.24 - 1.37
2014/05/15   -1,272,791    212,116     1.24       178,000    1.08 - 1.62
2014/04/30     -516,692  1,484,907     1.48         56,800    1.35 - 1.48
  * - Indicates that the closing price used is the last non-zero closing price and is not the closing price on the report date.

Summary: Still Very Risky, But Potentially Interesting Upside...

In short, blinkx has been the subject of a concerted short selling attack, has not helped itself by then following this with a profit warning, but now resides at an extremely attractive valuation level, IF you believe in the business model. Not a stock to put your granny's life savings into, certainly, but perhaps one worthy of consideration for a modest long position.
I personally am looking for an initial price target at around 50p. But more than ever with this stock, Do Your Own Research!
Edmund
Disclosure: I have bought some Blinkx (LON:BLNX) shares in my NISA. 
- See more at: http://www.stockopedia.com/content/blinkx-and-you-may-miss-the-rebound-85674/#sthash.Jv4Yg0rP.dpuf

Wednesday, 27 August 2014

Fairpoint plc: Ditch the Ethical Qualms, Buy It

53fca44913552fairpoint.png  Brief intro to Fairpoint (£FRP): from their own website 
(http://www.fairpoint.co.uk/):

Fairpoint is a consumer financial services business focused on serving financially stressed consumers. Our mission is 'Making money go further'.
Our business is structured into the following primary business lines in order to serve the needs of this consumer group:
  1. Individual Voluntary Arrangements (IVAs)
  2. Debt Management Plans (DMPs)
  3. Claims Management
Fairpoint's Key Brands
53fca75f67422FRP_brands.JPG

Reasons to Be Attracted to Fairpoint (LON:FRP)

While you may not approve of the types of debt management services that Fairpoint provide (e.g. there are free debt management services available to indebted individuals), there are a number of solid investment reasons underlying my enthusiasm for this £58m market cap small-cap stock: 
  1. Valuation is attractive;
  2. Profitability and cash generation are impressive;
  3. Income return is good in this ZIRP environment with a 5% dividend yield;
  4. Stock price momentum is picking up, breaking resistance levels to the upside;
  5. Acquisition strategy is cautious and sensible, delivering growth at a decent price.
This is all summarised nicely in Fairpoint's UK StockRank:
53fca62591323FRP_stockrank.JPG

Valuation: Cheap as Chips!

Whichever way you look at it, Fairpoint (LON:FRP) looks good value with a single-digit P/E and 9% free cash flow yield:
53fca7cc6b247FRP_Value.JPG

Income: a 5% Yield is not to be sniffed at!

Note not only that Fairpoint (LON:FRP) pays a 5% yield today, but that it is well covered at only a 40% payout ratio; not further that dividends have been steadily increased since they were initiated in 2010. 

Growth: Double-Digit Top-Line Growth

Thanks in part to a prudent acquisition of law firm Simpson Millar, paid in part in shares via an earn-out (on targets set for June 2015 and June 2016), top-line growth should be double-digit both this year and next, driving sales from £28.4m at end-2013 to a forecast £36.1m by end-2015. 
We can look at profit growth through the lens of the simplest 1-stage Gordon Growth Model, according to which, Fairpoint's internal growth rate is:
ROE x (1 - Payout Ratio) 
= 11% x (1 - 40%) = 6.6%
This would in turn imply a long-term total return rate at around 12%, including the 5.1% dividend yield. But don't forget, Fairpoint's balance sheet is somewhat inefficient, with a net cash balance of £2.8m, which suggests that the underlying ex-cash ROE is closer to 13%, pushing the internal growth rate beyond 7%.

Profitability and Cash Generation: Very Solid

As the 96 Quality Rank implies, Fairpoint is high quality when running it by the numbers whether looking at profitability or cash flow:
53fcabae90ef0frp_qUAL.JPG
53fcabc25406cfrP_HEADER.JPG
53fcabe1bca54FRP_CF.JPG

Stock Momentum: Interesting Breakout 

Fairpoint is breaking above a key horizontal resistance level of 135p; my first price target is thus 155p, the price gap that opened up on May 20. Beyond that, I am looking to around 231p, last seen in mid-2008 when business was strong (due to the weakening economy). 
53fcb485a8f00FRP_chart.JPG

Stock Ownership: Extremely Concentrated Already

Another interesting feature of this stock is that stock ownership is extremely concentrated, making the stock vulnerable to an upwards stock squeeze in the event of any good news:
53fcb505d562bFRP_shareholders.JPG
Three small-cap specialist fund management firms hold nearly 60% of the outstanding shares, including the top-ranked UK small-cap fund manager Gervais Williams at Miton (who runs The Diverse Income Trust plc amongst other funds - in which Fairpoint (LON:FRP) is the third-largest holding at 1.8% of the investment trust).
So any good news could see a big upwards squeeze in the shares in short order!
As always, please Do Your Own Research, however I have hopefully given you some points to chew over!
Disclosure: I hold Fairpoint shares in my SIPP
Edmund

Friday, 4 July 2014

Value Small-Cap of the Month: The Mission Group (TMMG) - Media Sector

Every month, I will be focusing on a compelling mid- or small-cap value story. This month, I a going to focus on a UK media company called The Mission Group (code LON:TMMG), whose current market value is £39m, and is listed in the AIM segment of the London market.

What Do They Do?

The Mission Group is comprised of a number of marketing, advertising and public relations agencies (11 in total), based in the UK, San Francisco and Singapore. Key clients include Tesco, Volvo, Scania and Virgin Atlantic. 

You can find a lot more information about The Mission on their web site.

Where is the Value?

In simple terms, The Mission is cheap on a number of traditional value metrics including forecasts P/E, price/book value and price/sales (Figure 1):

1. TMMG is Cheap!
Source: Stockopedia

For lovers of combining Value and Quality criteria, The Mission comes out extremely well on Piotroski's combination of low price/book value ratio (0.6x) and his F-score of quality, where the Company scores a high 8 out of a possible 9. So The Mission looks great value at least. 

The Total Shareholder Yield also looks strong, combining a 2.3% dividend yield with a £1.7m reduction in net debt worth another 5% or the Company's market cap, so a total yield of well over 7%, in line with the Free CashFlow Yield of just under 10%. 

What about Momentum?

Secondly, price momentum over the last 3 and 12 months has been very positive, with the shares gaining some 16% and 82% over these two periods respectively. 

2. TMMG Has Already Made Some Impressive Price Gains

3. But There is a Long Way to Go To Regain Prior Highs


But back in late 2007, the stock reached a high of 150p, if only briefly. So even after such impressive gains over the last 12 months, it would need to nearly triple to get back to historic highs. 

And Is There a Reason to Buy the Company Now?

Key highlights from The Mission's 2013 Annual Report were encouraging:
  • Revenue +9% to £51.6m;
  • Profit Before Tax +3% to £5.0m;
  • Net Debt sharply lower to £10.7m, -£1.6m versus FY2012;
  • Annual dividend of 1.0p put in place, versus nil before.
So operating trends certainly look promising, while back in February this year, the Investor's Chronicle publication highlighted The Mission as a very cheap recovery stock. 

A key driver for the Company, as for all advertising-related companies, is the strong underlying economic growth being experienced in the UK, with London the epicentre. Normally, domestic economic growth has a leveraged effect both on top-line revenues (clients want to spend more on advertising) and also on profitability (as the major cost of ad agencies are their staff salaries, plus office rent, which are largely fixed). 

What are the Risks?


  1. Even after nearly halving the debt in 4 years since 2009, there is still nearly £11m of net debt outstanding (Figure 5).That said, this is less than 1.5x the 2014e forecast EBITDA of £7.7m, so normally this should not be a big issue.
  2. The promised boom for advertising from the growing economy may not materialise as expected.
  3. Most of the stated book value is net Goodwill (£71m), so who knows what the true economic worth of TMMG's intangibles like branding, network etc. really is?  

5. TMMG's Balance Sheet


Investment Summary

Overall then, TMMG is very cheap, with a share price that is moving up nicely (has broken through recent price highs) but which has plenty of scope to move up further before hitting all-time historic highs, together with plenty of leverage to the improving UK economy. 

On Stockopedia's StockRanks system, this all adds up to a near-maximum 99 combined StockRank (Figure 6)!

6. TMMG's Combined StockRank is 99!
Source: Stockopedia

So The Mission (TMMG) is the first company to go into my UK Model Portfolio, at an entry price of 54.75p.

Edmund

Wednesday, 25 June 2014

Bowleven: An interesting junior oil play on the rise

Why Bother Looking at Bowleven (code: BLVN.L)?

  1. Value: A very cheap stock on certain deep value measures: Price/Book Value ratio of 0.4x;
  2. Value (2): Estimated Net Asset Value per share (BMO, Barclays): 99-135p. Current share price: 40.8p: Price/estimated NAV: 0.3-0.4x;
  3. Catalyst: Agreement to sell down a 50% interest in its Etinde permit offshore Cameroon for Lukoil and NewAge for a total $250m, giving Bowleven enough cash to finance its share of development capex through to finding first oil (25% share left);
  4. Revaluation: Offshore Cameroon oil & gas resources worth potentially 70p/share for Bowleven, 71% higher than current share price.
  5. Technical: BLVN.L share price has bottomed out, now rising steadily, gap to close at 52p. 

A Small-Cap in one of my favourite sectors: Oil & Gas

I remain unashamedly keen on the global Oil & Gas sector, with recent Middle Eastern geopolitical worries in Iraq, Syria and Libya keeping the Brent crude oil price at relatively elevated levels, despite the onrush of shale oil production Stateside. 

Bowleven (BLVN.L) is a junior oil exploration company (market capitalisation £130m) with development interests offshore Cameroon in Africa. 

The Etinde permit, the subject of this latest stake sale to Lukoil and NewAge, comprise 3 blocks MLPH-5, 6 and 7 (Figure 1). 

1. Etinde permit, offshore Cameroon
Source: company

While I admit that I am no oil & gas specialist, Bowleven piques my interest as an investor for a number of reasons, despite the rather large stumbling block of being loss-making at present (consensus EPS estimates are pegged at a loss of $0.036 for this year and $0.035 in 2015), which normally rules a company out of consideration for me. 

Value: Lots of unexploited value in Cameroonian assets

The stated balance sheet gives a trailing book value per share of $1.82 (Figure 2), which translates to 107p at the current $1.70 exchange rate. 

2. Balance sheet shows lots of potential value hidden

This gives a price/book value ratio of just 0.4x, including the $38m of cash already on the balance sheet, before the cash infusions from the stake sale to Lukoil and NewAge. 

3. Price Book Valuation Attractive
Source: stockopedia.com

The stake sale to Lukoil and NewAge is to bring in some $170m initially on completion (in September), plus assigns $80m further cash and carry thereafter dependent on completion of certain milestones (details can be found here). 

Taking the $32m on the balance sheet already (as of February) plus the $170m the company is to receive initially amounts to $202m, or £118m which is virtually Bowleven's entire market cap today. 

If you add the $80m contingent value from the deal, then we arrive at £166m. Of course, Bowleven is going to spend much of this cash in developing their share of these blocks to hopefully start to produce oil, but this is the situation today. 

Value (2): Net Asset Value Estimates of 99p - 135p

Broker research from Barclays and BMO pegs the Net Asset Value (NAV) of Bowleven (prior to this latest deal) at somewheere between 99p (BMO's estimate; Figure 4) and 135p (Barclays' estimate), yielding a price/NAV ratio of 0.3-0.4x. 

4. BMO's NAV estimate for BLVN.L
Source: BMO Capital Markets

Now a Takeover Candidate?

With this Lukoil/NewAge deal finally validating Bowleven's oil exploration efforts, could it now even become a takeover target for a larger oil & gas concern? There are plenty of large companies looking to add oil & gas reserves, and Bowleven is now both cash-rich and offers some interesting exploration assets. 

Of course, we can ask why Lukoil didn't just buy the entire company, if it was so obvious a deal. This is of course a very good question. Nevertheless, with this deal due to complete in September, something may still happen in this regard... I am certainly not banking on this prospect, but it is a nice free option to have. 

Why still so cheap then?

While Bowleven is a retail investor favourite, it has had a very chequered history, culminating in the last rights issue in November 2013 when 29.47m shares were issued at 45p, 10% above the current share price. So current shareholders have certainly suffered over the last few years with this stock, judging by the long-term price chart (Figure 5):

5. Bowleven's Long-Term Price Chart: A Tale of Woe
Source: Bloomberg

It is hardly surprising that some major shareholders are unhappy with the current deal, e.g. Bowleven-rocked-by-row-after-asset-sale

Technical View: Solid Uptrend Established, Gap to Fill at 52p

Three things to note on the short-term chart (Figure 6): 
  1. The previous downtrend has been broken;
  2. A new uptrend has been established;
  3. There is a gap to fill (from the time of the last share placing in November 2013) at 52p.
6. Bowleven's Short-Term Chart is Encouraging
Source: Bloomberg


Summing it all up: A Speculative Value Opportunity in Oil

Bowleven is certainly speculative, but has an interesting combination of value opportunity, catalyst and positive technicals in a sector that I favour, trading at 41p. 

But as always, this is just my view, not an official recommendation by any means, so as always, Do Your Own Research!!

Disclaimer: I do not hold Bowleven shares at present, though may initiate a position in the next 48 hours...

Tuesday, 6 May 2014

Stay in May and don’t fly away…

I find that I am greatly tiring of the plethora of articles which arrive around this time of year, urging investors to “sell in May and go away – come back on St Leger’s day”. Every year following May Day it is the same story but I believe the record needs to be set straight…

1. Yes, November to April is the strongest seasonal period for the FTSE 100 Index

As Figure 1 illustrates, the FTSE-100 index has typically posted its strongest seasonal performance over the six months from the beginning of November to the end of April the following year, judging from average monthly returns since 1986. December returns (including dividends) have averaged 2.6%, while April has been the second-best month at 2.1%.
1. FTSE-100 Index Has Posted Strongest Returns in December, April
Source: Author, Bloomberg
Judging from this 29-year history for the FTSE-100, May comes in as the ninth-best month for stockmarket returns, with a 0.3% – not all that impressive but nevertheless a positive average return.

2. And yes, this is true also for emerging market stocks…

Figure 2 shows the average monthly returns since 1990 for the MSCI Emerging Markets index, the main benchmark index used for investing in this geographic segment.
 
2. Emerging Market Stocks Show an Even More Pronounced Seasonal Effect
Source: Author, Bloomberg
 
In the case of emerging markets, the average return has been zero for the month of May, typically following a strong April, which has typically been the second-best month for emerging market gains.

3. The real danger period for UK stocks is between June and October

If we look at the table in Figure 3, which shows monthly returns for the thee UK FTSE stock indices by size, we can see the real danger period for stocks historically has really been June to October, with negative returns registered on average over two to three of these months.

To read the rest of this article, view the conclusions and all the charts,
please click on the link below: