Friday 27 June 2014

Buying Into Black Gold, for the Long-Term

Oil As a Strategic Long Holding

Here are some reasons why I think that the Energy sector and Oil is still an excellent long-term investment theme for some time to come, with a couple of short-term drivers to drive oil-related commodity and share prices to boot...

1. Seasonal Effect - US Gasoline Prices Break Out For Summer (Driving Season)


Source: St. Louis Fed, Bloomberg


Energy: The Long-Term View

2. Long-Term Oil Driver: Consumption Growth from China, India etc.


3. So far, Non-OPEC (North America) Production Growth Has Kept Up


4. But Will Be Tough to Keep Up With Demand...


Energy: Short-Term Risks


5. Iraq, already OPEC's 2nd-Largest Producer, Is Forecast Huge Production Growth


6. With ISIS Advances, Iraqi Civilian Deaths Now Highest Since 2007


Investment Conclusions

7. Buy US Integrated Oil, Oil Services, MLP Stocks on Weakness
(JPMorgan MLP ETF: US code AMJ; 
iShares Oil Equipment & Services ETF: US code IEZ)


8. Buy US Oil, LNG Shipping On US Export Growth
(Guggenheim Shipping ETF: US code SEA; 
Teekay Corp. (US code: TK)


Summary


  1. The Oil Sector Remains A Key Long-Term Investment Theme
  2. World energy demand to grow fast
  3. Short-Term: Geopolitical Risks to OPEC Oil Production (Iraq)
  4. US, European Oil Stocks to Continue to Outperform
  5. The PowerShares DB Commodity Index ETF (US code DBC) one way to play higher Brent crude oil, gasoline prices.

Wednesday 25 June 2014

Bowleven: An interesting junior oil play on the rise

Why Bother Looking at Bowleven (code: BLVN.L)?

  1. Value: A very cheap stock on certain deep value measures: Price/Book Value ratio of 0.4x;
  2. Value (2): Estimated Net Asset Value per share (BMO, Barclays): 99-135p. Current share price: 40.8p: Price/estimated NAV: 0.3-0.4x;
  3. Catalyst: Agreement to sell down a 50% interest in its Etinde permit offshore Cameroon for Lukoil and NewAge for a total $250m, giving Bowleven enough cash to finance its share of development capex through to finding first oil (25% share left);
  4. Revaluation: Offshore Cameroon oil & gas resources worth potentially 70p/share for Bowleven, 71% higher than current share price.
  5. Technical: BLVN.L share price has bottomed out, now rising steadily, gap to close at 52p. 

A Small-Cap in one of my favourite sectors: Oil & Gas

I remain unashamedly keen on the global Oil & Gas sector, with recent Middle Eastern geopolitical worries in Iraq, Syria and Libya keeping the Brent crude oil price at relatively elevated levels, despite the onrush of shale oil production Stateside. 

Bowleven (BLVN.L) is a junior oil exploration company (market capitalisation £130m) with development interests offshore Cameroon in Africa. 

The Etinde permit, the subject of this latest stake sale to Lukoil and NewAge, comprise 3 blocks MLPH-5, 6 and 7 (Figure 1). 

1. Etinde permit, offshore Cameroon
Source: company

While I admit that I am no oil & gas specialist, Bowleven piques my interest as an investor for a number of reasons, despite the rather large stumbling block of being loss-making at present (consensus EPS estimates are pegged at a loss of $0.036 for this year and $0.035 in 2015), which normally rules a company out of consideration for me. 

Value: Lots of unexploited value in Cameroonian assets

The stated balance sheet gives a trailing book value per share of $1.82 (Figure 2), which translates to 107p at the current $1.70 exchange rate. 

2. Balance sheet shows lots of potential value hidden

This gives a price/book value ratio of just 0.4x, including the $38m of cash already on the balance sheet, before the cash infusions from the stake sale to Lukoil and NewAge. 

3. Price Book Valuation Attractive
Source: stockopedia.com

The stake sale to Lukoil and NewAge is to bring in some $170m initially on completion (in September), plus assigns $80m further cash and carry thereafter dependent on completion of certain milestones (details can be found here). 

Taking the $32m on the balance sheet already (as of February) plus the $170m the company is to receive initially amounts to $202m, or £118m which is virtually Bowleven's entire market cap today. 

If you add the $80m contingent value from the deal, then we arrive at £166m. Of course, Bowleven is going to spend much of this cash in developing their share of these blocks to hopefully start to produce oil, but this is the situation today. 

Value (2): Net Asset Value Estimates of 99p - 135p

Broker research from Barclays and BMO pegs the Net Asset Value (NAV) of Bowleven (prior to this latest deal) at somewheere between 99p (BMO's estimate; Figure 4) and 135p (Barclays' estimate), yielding a price/NAV ratio of 0.3-0.4x. 

4. BMO's NAV estimate for BLVN.L
Source: BMO Capital Markets

Now a Takeover Candidate?

With this Lukoil/NewAge deal finally validating Bowleven's oil exploration efforts, could it now even become a takeover target for a larger oil & gas concern? There are plenty of large companies looking to add oil & gas reserves, and Bowleven is now both cash-rich and offers some interesting exploration assets. 

Of course, we can ask why Lukoil didn't just buy the entire company, if it was so obvious a deal. This is of course a very good question. Nevertheless, with this deal due to complete in September, something may still happen in this regard... I am certainly not banking on this prospect, but it is a nice free option to have. 

Why still so cheap then?

While Bowleven is a retail investor favourite, it has had a very chequered history, culminating in the last rights issue in November 2013 when 29.47m shares were issued at 45p, 10% above the current share price. So current shareholders have certainly suffered over the last few years with this stock, judging by the long-term price chart (Figure 5):

5. Bowleven's Long-Term Price Chart: A Tale of Woe
Source: Bloomberg

It is hardly surprising that some major shareholders are unhappy with the current deal, e.g. Bowleven-rocked-by-row-after-asset-sale

Technical View: Solid Uptrend Established, Gap to Fill at 52p

Three things to note on the short-term chart (Figure 6): 
  1. The previous downtrend has been broken;
  2. A new uptrend has been established;
  3. There is a gap to fill (from the time of the last share placing in November 2013) at 52p.
6. Bowleven's Short-Term Chart is Encouraging
Source: Bloomberg


Summing it all up: A Speculative Value Opportunity in Oil

Bowleven is certainly speculative, but has an interesting combination of value opportunity, catalyst and positive technicals in a sector that I favour, trading at 41p. 

But as always, this is just my view, not an official recommendation by any means, so as always, Do Your Own Research!!

Disclaimer: I do not hold Bowleven shares at present, though may initiate a position in the next 48 hours...

Friday 20 June 2014

Tracking the Surprising Gold, Silver Rally

I thought I would just post up some charts looking at the surprisingly strong rally in Gold and Silver of late, that has been boosted in particular by the recent Federal Reserve meeting in the US, with no change of speed on monetary policy announced (i.e. they are not looking to raise interest rates faster than previously expected). 

So here are some charts looking at Gold and Silver, that may give some clues as to whether the current rally can continue:

1. Gold Breaks Out of 200-day Moving Average


2. Rally in Silver Even Stronger


3. A Weaker US$ Is Helping Gold and Silver Post-Fed Meeting


4. A Relaxed Fed and Improving Growth is Pushing up
Long-term Inflation Expectations


5. Gold ETF Holdings Relatively Stable in 2014


6. Seasonal Effects Favour Silver, Gold from late June


7. China and India Drive Gold Jewellery Demand 


8. Gold is Cheap Relative to Oil

Summary

  1. Gold, Silver benefit from short-covering post Fed meeting
  2. Gold, Silver break above their 200-day moving averages
  3. Seasonal Effects Favour Silver in July, Gold in August, Sept.
  4. Is this just a short-covering rally or something longer-term?
  5. Rising inflation expectations may boost Gold further


Wednesday 18 June 2014

Hunting Bond-Beating Income Ideas: Stocks, Funds

With short-term bank deposit accounts now offering well under 2% interest, and even loaning money to the UK government for 10 years (via Gilts) only garnering a meagre 2.7%, a lot of savers and investors will be wondering where they can put their money for a better income stream. 


Look to Corporate bonds?

The first obvious port of call could be sterling investment-grade corporate bonds, which offer a 3.8% yield at present, a 1.8% improvement on the yield offered by UK 5-year gilts (Figure 1).  

1. UK Corporate Bonds Offer 3.8% Yield

Source: Bloomberg

The easiest investment vehicle for this would be an ETF like the Core £ Corporate Bond UCITS ETF (code: SLXX), which charges just 0.2% per year in management fees for this bond exposure and yields 3.5% net of fees. 

What about income funds? 

A second possibility would be an income fund of some description, which could potentially yield as much or more than UK corporate bonds, but which can also include some element of dividend growth going forwards.

 An interesting income proposition in the investment trust world could be the income shares of the JPMorgan Income & Growth investment trust (code: JIGI), which invests in blue-chip income stocks. This split-capital trust is due to wind up at the end of November 2016, at which point investors will receive the net asset value per share of the fund less winding-up costs. 

At the moment, these income shares trade at a 8.4% discount to the final Redemption Price of 103.4p, while offering a generous 4.7% dividend yield. If the NAV was to remain at its current level at wind-up date, then income share investors stand to receive 9.9p in cumulative dividends between now and then, plus another 8.6p from the closing of the gap to the redemption value, i.e. 18.5p in total on a 94.75p share price, or nearly 20% return over the next 2.5 years, roughly an 8% annualised return with good visibility. 

Otherwise, an dividend income-focused ETF like the iShares UK Dividend UCITS ETF (code: IUKD) could be an option, offering a 4.0% dividend yield from a dividend-weighted portfolio of UK large-cap stocks including SSE, Imperial Tobacco and BP.

Both of these fund choices would give you a one-stop equity fund offering a yield above the 3.5% from the UK corporate bond ETF. 

Choosing Bond-Beating Income Stocks

The third option is to make up your own income stock portfolio by choosing a number of high-yielding stocks. If we take the target as a current yield above the corporate bond ETF's 3.5%, and add requirements to favour stocks that should also deliver an above-inflation rate of dividend growth going forwards, then we can create our own "bond-beating" stock portfolio. 

Using www.stockopedia.com's UK stock screening tool, I built my own simple screen looking for UK stocks that yield 3.5% or more, whose dividend is covered by earnings to the tune of at least 1.5x (to leave room for future growth) and which are in the top 30% of Stockopedia's combined StockRanks ranking (which combines Value, Quality and Momentum criteria). 

Here is the list of the Top 25 stocks on the resulting screen, ranked by best combined StockRank:

2. Bond-Beaters UK Screen

Source: www.stockopedia.com

This screen, if replicated as a 25-stock equal-weighted portfolio, would have an average dividend yield of 4.6% and dividend cover of nearly 2x, leaving ample room for profit and dividend growth. 

You may notice that a couple of sectors are well-represented here, including the Insurance (Catlin, Amlin) and Property (UK Commercial Property Trust, New River Retail) sectors, which remain two of my personal favourite UK sectors for the moment given their attractive combination of value and momentum.

Of the names in this list, I would be keen on Amlin (code: AML) given its strong record of profitability and very steady historic dividend growth (more detail here), and also New River Retail (code: NRR) given its low level of net gearing for a property company (18% of equity) and leverage to an improving UK consumer (as real average wage growth turns positive at last). 

Edmund


Friday 13 June 2014

Video: How to build an efficient portfolio using ETFs

Video: How to build an efficient portfolio using ETFs

I recorded a 20-minute webcast on Thursday together with John Lapping of Mindful Money and Ben Thompson of Lyxor/Societe Generale on the subject of building an efficient portfolio using ETFs.

To watch a video replay of this webcast, please cliek on the web link below:


Crude gets an Iraq Spike: Value Oil Companies Lead The Market

Crude Oil Spikes Up on Iraq Tensions

That the Isis rebels are advancing on Baghdad has sent shudders through the crude oil market, with Brent Crude oil prices breaking above their 9-month trading range to hit over $113/barrel today (Figure 1).

1. Brent Crude Oil futures head back to the 2013 highs
Source: Bloomberg

Iraq is projected to be 11% of OPEC output this year

With OPEC representing over 40% of global crude oil production, and Iraq forecast to produce 11% of OPEC's crude output this year, any long-lasting disruption to Iraqi oil production could keep crude oil prices higher than expected, in spite of the burgeoning production of oil and gas from US shale deposits. 

2. Iraq is projected to produce 11% of OPEC's Oil Output This Year
Source: OPEC

UK, European, US Oil Companies Outperforming

At a time when global stock markets could finally be stalling in the short-term after breaking new all-time highs, the oil & gas sectors on both sides of the Atlantic have maintained strong upwards momentum thanks in part to this geopolitical boost, comfroatbly outstripping the wider benchmark stock indices. 

3. European and US Oil Stock Gains in the Double-Digits This Year
Source: Bloomberg

So Which Oil Stocks Look Particularly Attractive Right Now?

In the US, my attention has been drawn to oil-related stocks that have under-performed up to now, but which are starting to rebound sharply. Noble Corporation (US code: NE) is one such company, an offshore drilling contractor which is very cheap at 9.5x forward P/E, 0.9x price/book and offers a tempting 4.3% dividend yield (more than twice that offered by the S&P 500 index). 

4. Noble Corporation An Attractive US Value-Momentum Play
Source: Bloomberg

But what could you look at in Europe (and the UK)? 

I must declare that I work for BCS, which is a Russian financial services company that offers with Asset Management and also Broking. So if you have the stomach for an emerging market oil play, you could of course look to Russia, which after all is an economy and stock market that tends to be highly correlated to the oil price over time. 

High Risk, High Reward?

The Russian oil stock that comes out high on Stockopedia's QVM (Quality-Value-Momentum) combined stockrank is Rosneft (LON Int: ROSN) (Figure 4), with a combined StockRank of 97, a Value rank of 98 and Quality rank of 95. The dividend yield of 4.3% also pays an investor to be patient.

4. Rosneft Near the Top of the Stockopedia QVM StockRank

Oil Services Still My Favourite: AMEC, Wood Group

Otherwise, I am still a big fan of Oil Service companies given the Shale Oil & Gas investment theme. The key to remember is this: that shale oil and gas producers need to continue to drill a huge number of new wells not only to keep up production growth, but even to maintain existing levels of production! With shale oil, well depletion rates are far higher than with conventional oil wells, hence there is correspondingly more business for oil service companies helping them to get the oil out of the ground, process it and then transport it!

I continue to favour both AMEC (LON: AMEC) and Wood Group (LON: WG) as they both come at or near the top of the combined QVM StockRank within the Oil & Gas sector, AMEC with a near-maximum combined StockRank of 99, and Wood Group with a high 85 StockRank (Figures 5, 6). 

5. AMEC Top of the StockRanks!

6. Wood Group: Good Value, Momentum to be Had


Have fun "drilling down" on these oil stock ideas!

Edmund
idleinvestor@idleinvestor.com

Tuesday 10 June 2014

Ride the oil bonanza!

One thing to remember about the world economy is that, as economic growth accelerates, so does energy demand in general. After all, it is not accident that the biggest reduction in developed world CO2 emissions occurred over the financial crisis of 2008-2009, when the G7 economies suffered an unprecedented slump in growth. So the converse is also true, that stronger economic growth points to higher energy demand – which should be good for oil demand, as car and aircraft mileage is still fuelled by petrol, diesel and kerosene.


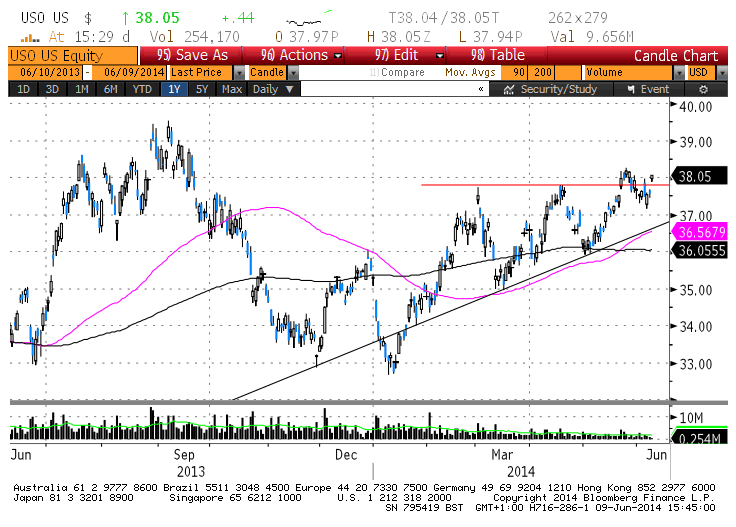
So it is indicative to see that the US Oil ETF (code: USO) has indeed started to break a new high in the past few days (Figure 1), moving back above the $38 mark.


1. US OIL ETF MOVING HIGHER


Getting Exposure via Sector ETFs

One way to get some exposure to this theme in your portfolio is via oil & gas sector ETFs, which provide a basket of oil & gas stocks in one fell swoop – remember that an advantage of buying an ETF is that you don’t pay the 0.5% stamp duty that you would pay if buying an individual oil stock like BP or Royal Dutch Shell. The two major oil & gas sectors, the STOXX Europe Oil & Gas sector (green line in the chart below) and the US S&P 500 Energy sector (black line), are both posting impressive upwards trends at the moment (Figure 2).


2. EUROPEAN AND US OIL & GAS SECTORS IN A BULLISH TREND


In Europe, were you to to buy the Lyxor STOXX 600 Oil & Gas sector ETF (code: OIL), you would be buying a listed fund that has 24% exposure to the French Total integrated oil giant, 15% in Royal Dutch Shell, 14.4% in BP and over 10% in BG, plus smaller stakes in other integrated oil and also oil exporation and oil service companies.


A key attraction of the European Oil sector is its high dividend yield, which currently stands at over 4%.


But What About Individual Oil Stocks?

Of course, you can always look at individual oil stocks – I have in the past extolled the virtues of Royal Dutch Shell (RDSA.L; three-stocks-to-profit-from-a-value-rotation), which has certainly performed well so far this year, rising from around 2150p to 2367p currently. Despite this strong price gain, RDSA is on course to deliver a 4.7% dividend yield this year, which is certainly not to be sniffed at given the near-zero cash deposit rates on offer from the banks.


But if you want better leverage to upwards movement in the oil price and the world economy, then I would recommend looking at oil service stocks – i.e. those companies providing the picks, shovels and expertise to oil exploration and production companies. Currently they are able to command high prices and thus push up their profitability as the US shale oil & gas bonanza continues. UK-listed companies that could be worth looking at now include:


  • Lamprell (LAM.L): provides construction and engineering services for oil and gas rigs. Valuations remain reasonable, and the price chart shows that Lamprell has just broken out of a multi-month sideways trading range pattern to hit 174p today.


  • Wood Group (WG.L): is an international energy services company providing services and products to the oil, gas and power industries. This is also showing signs of breaking our from an important resistance level, now at 804p. Still only at 13.3x forecast P/E and 9x EV/EBITDA, which seems eminently reasonable for this high-quality company.


  • AMEC (AMEC.L): provides consulting, engineering and project management services to the energy, power and process industries. Trades on 14x forecast P/E and offers a decent 3.6% dividend yield too. AMEC has just broken to a new multi-year high of 1262p – and remember, new highs tend to be followed by further price gains, so don’t let this fact put you off investing!


So buy into the Oil momentum boom, whether via a sector ETF or individual stocks!

Friday 6 June 2014

Bloomberg TV June 6, 2014: Draghi's actions were aimed squarely at helping the Euro economy

From my Bloomberg TV interview this morning, here are two videos to watch (just click on the links below):


All the best for the weekend,
Edmund

Thursday 5 June 2014

Asos – a timely reminder of the dangers of “glamour” stocks and four with more appeal

Okay, let’s start with a quick disclaimer: as a fund manager, I admit that I have a bent towards stocks that display a combination of value (cheap), quality (profitable) and momentum (prices moving higher) characteristics. So given Asos’ (code: ASC:L)  lofty 2014 forecast P/E ratio of 77x as of yesterday, it was clearly never going to be one of my favourites.

A quick glance at Asos’ long-term weekly chart (Figure 1) tells you why this online fashion retailer has long been a favourite of retail investors, with a share price that multiplied by over 15 times from a low around 430p in early 2010 to a high of over £70 hit in March this year.


1. THE METEORIC RISE OF ASOS SINCE 2010

Source: Bloomberg


So what does today’s profit warning tell us?

Asos has today informed the market that sales growth is slowing and, even more importantly, that profit margins will be a lot lower than expected (4.5% rather than around 6.5%). This follows a warning in March that earnings would be impacted this year by increasing levels of investment.

Today’s warning has now taken Asos’ share price down to around £31 at time of writing (Figure 2), less than half of its March peak but still representing a 2014e P/E valuation of 52x, before the analysts even take out their red pens and cut their earnings forecasts. So in reality, Asos’ valuation will turn out to be far higher than 52x… This at a time when the overall UK stock market is rated at 14x this year’s earnings, falling to 12.8x for 2015.


2. ASOS HAS COME DOWN TO EARTH WITH A BIG BUMP SINCE MARCH…


The lesson to be learned here is that blindly following momentum is a dangerous strategy, once that momentum has turned. Remember that following the first warning from Asos in March, the share price had already fallen from over £70 to a mid-May low of £38.50. Investors had been given plenty of fair warning to sell their stocks at a level far higher than today’s £31…


To read the rest of this article, including the strategy and 4 stocks I would look at instead of Asos, please click on the web link below:


on CNBC Squawkbox as Guest Host, Wednesday 4 June

CNBC TV:
Edmund Shing, global equity portfolio manager at BCS Financial Group, discusses the oil and gas market and says infrastructure is the best way to invest in oil.