Showing posts with label Sectors. Show all posts

Tuesday, 10 June 2014

Ride the oil bonanza!

One thing to remember about the world economy is that, as economic growth accelerates, so does energy demand in general. After all, it is not accident that the biggest reduction in developed world CO2 emissions occurred over the financial crisis of 2008-2009, when the G7 economies suffered an unprecedented slump in growth. So the converse is also true, that stronger economic growth points to higher energy demand – which should be good for oil demand, as car and aircraft mileage is still fuelled by petrol, diesel and kerosene.


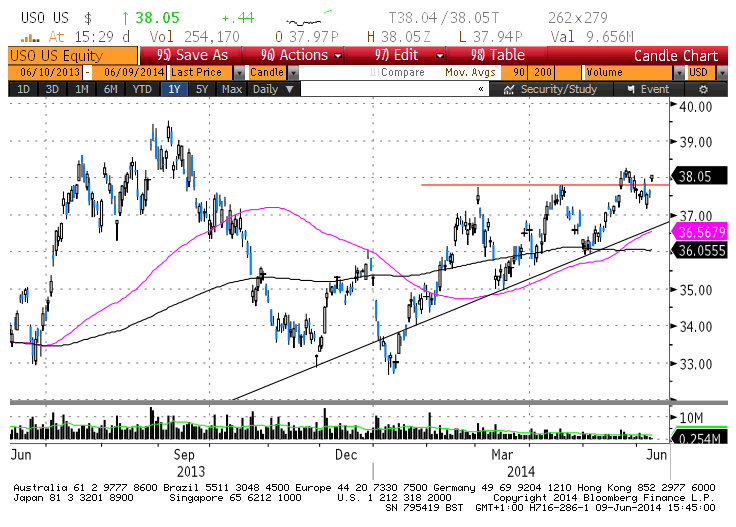
So it is indicative to see that the US Oil ETF (code: USO) has indeed started to break a new high in the past few days (Figure 1), moving back above the $38 mark.


1. US OIL ETF MOVING HIGHER


Getting Exposure via Sector ETFs

One way to get some exposure to this theme in your portfolio is via oil & gas sector ETFs, which provide a basket of oil & gas stocks in one fell swoop – remember that an advantage of buying an ETF is that you don’t pay the 0.5% stamp duty that you would pay if buying an individual oil stock like BP or Royal Dutch Shell. The two major oil & gas sectors, the STOXX Europe Oil & Gas sector (green line in the chart below) and the US S&P 500 Energy sector (black line), are both posting impressive upwards trends at the moment (Figure 2).


2. EUROPEAN AND US OIL & GAS SECTORS IN A BULLISH TREND


In Europe, were you to to buy the Lyxor STOXX 600 Oil & Gas sector ETF (code: OIL), you would be buying a listed fund that has 24% exposure to the French Total integrated oil giant, 15% in Royal Dutch Shell, 14.4% in BP and over 10% in BG, plus smaller stakes in other integrated oil and also oil exporation and oil service companies.


A key attraction of the European Oil sector is its high dividend yield, which currently stands at over 4%.


But What About Individual Oil Stocks?

Of course, you can always look at individual oil stocks – I have in the past extolled the virtues of Royal Dutch Shell (RDSA.L; three-stocks-to-profit-from-a-value-rotation), which has certainly performed well so far this year, rising from around 2150p to 2367p currently. Despite this strong price gain, RDSA is on course to deliver a 4.7% dividend yield this year, which is certainly not to be sniffed at given the near-zero cash deposit rates on offer from the banks.


But if you want better leverage to upwards movement in the oil price and the world economy, then I would recommend looking at oil service stocks – i.e. those companies providing the picks, shovels and expertise to oil exploration and production companies. Currently they are able to command high prices and thus push up their profitability as the US shale oil & gas bonanza continues. UK-listed companies that could be worth looking at now include:


  • Lamprell (LAM.L): provides construction and engineering services for oil and gas rigs. Valuations remain reasonable, and the price chart shows that Lamprell has just broken out of a multi-month sideways trading range pattern to hit 174p today.


  • Wood Group (WG.L): is an international energy services company providing services and products to the oil, gas and power industries. This is also showing signs of breaking our from an important resistance level, now at 804p. Still only at 13.3x forecast P/E and 9x EV/EBITDA, which seems eminently reasonable for this high-quality company.


  • AMEC (AMEC.L): provides consulting, engineering and project management services to the energy, power and process industries. Trades on 14x forecast P/E and offers a decent 3.6% dividend yield too. AMEC has just broken to a new multi-year high of 1262p – and remember, new highs tend to be followed by further price gains, so don’t let this fact put you off investing!


So buy into the Oil momentum boom, whether via a sector ETF or individual stocks!
Monday, 10 March 2014

Weekly Newsletter, March 10 2014

Is The Ukraine Question Going To Hit Markets Again?

And things seemed to be going so well for global stock markets! Mid- and Small-cap indices hitting new highs, then followed by the large-cap benchmark indices such as the S&P 500 in the US and the Euro STOXX 50 in the Eurozone. Then comes President Putin with his move into the Crimea (where the Russians maintain a strategically-important Black Sea naval port), and hey presto, we suffer a nasty, if short-lived, dose of market volatility.

But notice also that the trend in mid-term volatility (shown below) has been rising from the lows hit in early January, well before the Ukrainian-triggered flare-up in volatility over February.


1. US Mid-Term VIX Volatility Gently Rising

Source: Bigcharts.com


Whether or not this market volatility will worsen will depend on whether the US and Europe press ahead with any form of economic sanctions against Russia.


I believe that Europe in particular will not be hasty to pursue this course of action, given the value of Russian gas to the Old Continent.


A Few Energy Policy Considerations

This political instability in Ukraine underlines the fragility of European energy policy, given that one-third of Europe’s natural gas supplies come from Russia via the Ukraine (particularly important for Germany and the Netherlands). Thus, any economic sanctions against Russia are very likely to have a heavy hit for the European economy too, which is precisely why sanctions look unlikely in the near-term.


Of course, this means that European nations will not want to rely too heavily on Russia for natural gas output in the future, as this recent episode has underlined just how toothless they are in the face of volatile Russian foreign policy.


As they are committed in general to reducing their reliance on nuclear power (Germany in particular, but also France), what can they do about the precarious natural gas supply situation?

Industries That Should Benefit From This Situation

Renewables will benefit of course (solar, wind, hydro, biomass), which is one reason why clean energy funds have been performing so well (see chart below).

2. PowerShares Clean Energy ETF is Roaring Away

Source: Bigcharts.com


Algeria also benefits from French largesse as the French pay over the odds for Algerian natural gas supply for diversification reasons (and historic reasons too).


But I believe that the ultimate winner will be shale gas exploration and production in Europe, led of course by the UK. But other nations will inevitably follow…


I remain a big long-term fan of oil service companies can that enable/facilitate shale oil/gas exploration, extraction and processing/transportation. I would rather take exposure to these companies (who provide the “shovels”) rather than the exploration companies themselves, given the uncertain hit-and-miss nature of exploration activity.


The Oil Service companies have shown some excellent share price performance over the last month, with the IEZ iShares US Oil Equipment & Services ETF up 15% in a month!

3. iShares US Oil Equipment & Services ETF +15% in Feb.

Source: Bigcharts.com


UK-listed oil service companies that continue to do well on the back of this theme include: 


Kentz Corporation (KENZ.L), Petrofac (PFC.L), Wood Group (WG.L), 

KBC Technology (KBC.L) and AMEC (AMEC.L).


An Interesting Perspective on the Current Bull Market

This week, the bull market that started in 2009 celebrated its fifth anniversary. Now, there was a big correction back in 2011 at the peak of the Euro financial crisis, when the S&P 500 index lost almost 20% form peak to trough. Since then, we have surged back to hit new highs.


The chart below from www.chartoftheday.com puts the current stock market rally in to historic context. It highlights that the current rally in the US S&P 500 index is, thus far, nothing particularly remarkable or stretched when compared against previous historical bull market rallies.

4. Similar in Duration to the Average Rally, But Not As Strong!

Source:  www.chartoftheday.com

This all suggests to me that, should we navigate these choppy Eastern European without a full-scale “new cold war”, there is still further upside potential over the medium-term for developed stock markets, while economic growth momentum continues to slowly build up steam on both sides of the Atlantic Ocean.

Thursday, 27 February 2014

Still time to climb on the housebuilders’ ladder

Surely UK house builders have done so well already, that they can’t possibly have much further to go? When the heated state of the UK housing market becomes headline news on a regular basis, then as a stock investor, you have to be worried, right?

While that might normally make sense, in this case I would beg to differ. It is true that, since I wrote my last article extolling the virtues of UK house builders on February 4 (UK Building is All Systems Go!), the Bloomberg UK house builders’ index has risen some 9%, its pullback today notwithstanding.

But let me present a series of data that I find to be compelling evidence that the current bull market in housing-related stocks  still has some way to run…


Item 1: House Builders have 37% to go to Reach their 2007 Highs

Yes it is true! As a group, house builders like Barratt Developments (BDEV), Berkeley Group (BKG) and Persimmon (PSN) have 37% further to rise before they hit their June 2007 share price highs.


Item 2: Housing Starts Are Picking Up, But Still Below Average 

House builders are breaking ground on more new projects today than at any time since the first quarter of 2008. However they are still a long way from climbing back to the average for quarterly housing starts seen pre-Financial Crisis. 


Item 3: and Building Completions Are Even Worse…

If we look at the rate of building completions in the UK, the situation looks even worse...


Item 4: Mortgage Approvals Go Up, Mortgage Rates Down

And all the while, the UK Government is of course doing its bit to help the purchasing of new-build homes with their Help to Buy schemes, effectively guaranteeing the first 20% of a 95% loan-to-value mortgage, allowing first-time buyers to get on the property ladder with only a 5% deposit. No wonder then that the number of mortgage approvals is going up!


To read on, see the charts and see my favoured stocks for this theme,
click on this web link:


Wednesday, 26 February 2014

View my CNBC WorldWide Exchange TV interview!

Here is the video link to to my CNBC Worldwide Exchange interview from this morning:


Click on it and have a look!

Best,
Edmund

On CNBC Europe this morning - my preferred sectors...

I went on CNBC Europe's WorldWide Exchange programme this mornign to talk about company results and my favourite sectors. What are they? Well:


  1. UK housebuilders - like Inland Homes (INL), Barratt Developments (BDEV) and Telford Homes (TEF). Note the strong results this morning from builders' merchants Travis Perkins (TPK), helped by the strong UK housing market, together with the Government's aid from the Help 2 Buy programmes.
  2. Technology stocks, in particular semiconductors - Infineon (IFX in Germany) and Sandisk (SNDK in the US) would be two good plays here; cash-rich and benefiting from the "Internet of Things" theme.
  3. Mining stocks, which are cheap and recently posted good Q4 results: in the short run, they will be driven by sentiment over Chinese growth, but I still like Rio Tinto (RIO) and Anglo American (AAL) in the medium-term. 

While stock markets had a very strong 2013 and have bounced back to new highs this year, I see further positive momentum ahead as economic momentum picks up in the Eurozone, and recovers from a short-term dip in the US and China. 

Monday, 24 February 2014

Video Slideshow: Bull or Bear Market? Which sectors to favour?

Hello again,
 
I offer you this time a 5-minute video slideshow with audio commentary, tackling two questions:
 
  1. Are we still in a Bull stock market or have we entered a Bear market?
  2. Which industry sectors should you favour?


All the best,

Edmund

Tuesday, 14 January 2014

Early Morning Interview on Bloomberg TV - discussing US Media, technology stocks

Hi there,

You may be interested to hear what I had to say on Bloomberg TV early this morning (Tue Jan 14, 2014) on the subject of US Media and Technology stocks, in focus on the back of the unsolicited takeover offer for US cable operator Time Warner Cable from rival Charter, for $61bn in cash and shares.

I remain bullish on both these sectors for 2014, both in the US and in Europe...


Edmund

Tuesday, 29 October 2013

Dividend funds: caveat emptor!

Market Indicators Remain Positive

With the US S&P 500 stock index hitting new highs, we might ask ourselves if shares are finally starting to become expensive, and vulnerable to a near-term correction. Checking a number of my favourite market indicators, conditions look to remain favourable for stocks and shares. 

1. US advance-decline indicator hits new highs

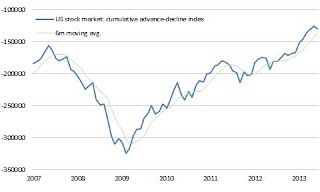
The cumulative advance-decline indicator, that measures how many stocks have gone up versus those that have gone down each day and adds the up-down balance up over time, continues to make new highs. This points to good market breadth, i.e. that the market is being driven by a large number of stocks rising. If this were not to reflect a similar pattern to that for the benchmark stock indices, then I would be concerned. But no worries here...

US Advance-Decline Index Remains very Bullish

 2. US Value Line Geometric Index Also Very Strong

A second measure of market breadth is the Value Line index, which looks at the performance of the average stock in the US. Again, if this were not to be making new highs at the same time as the benchmark stock indices, I would be concerned. But once again, things look good...
US Value Line Index Also In A Bull Trend

3. European Industrial, Bank Stocks Still Performing Well

In an economic recovery scenario, both industrial and financial stocks should perform well, reflecting the benefit of a stronger underlying economy for profits in both these cyclical sectors. Looking below, we can see that European Industrial (SXNP) and Bank (SX7P) sectors are still in strong uptrends, and close to new highs. 

European Industrials, Banks Close to New Highs

But High Quality Dividend Stocks Now Expensive In the US

Interestingly, stable dividend stocks have in particular started to become expensive as investors have looked for yields outside of the traditional bonds and cash sources, given the very low rates of interest currently on offer from both asset classes. 


US Dividend Aristocrat Dividend Yield at record low
The chart above represents the US dividend aristocrat ETF, which only holds US large-cap companies that have raised their annual dividend consistently each year over the last 25+ years. Members include healthcare companies like Johnson & Johnson, and consumer staple companies like Coca-Cola.  All very high quality companies, but now increasingly expensive, only offering a 1.8% dividend yield now as opposed to nearly 2.5% at mid-year. Clearly investors are looking for a better yield than they can get on bonds or cash, but without taking big risks and thus preferring to invest in companies that offer relative stability. 


Focus more on Small-Cap stocks

October has been a pretty good month for Small-Cap stocks, with both UK and US small-cap indices continuing to outperform the large-cap benchmarks and rising in a strong, steady pattern. Both small-cap indices have gained nearly 5% over the last month, continuing to forge new all-time highs. 

UK, US Small-Cap Indices In Steady Uptrend

Favour Industrials, Small-caps; Beware Overvalued Dividends

I remain a big fan of ETFs exposed to small-cap stocks such as the iShares MSCI UK Small-Cap ETF (CUKS) and the iShares S&P Small-Cap 600 ETF (ISP6). You could get exposure to Small-Cap stocks in Europe overall via the db x-trackers MSCI Europe Small-Cap ETF (XXSC). With capital expenditure trends improving, European Industrials also remain a good area for investment at this moment: db x-trackers STOXX 600 Industrial Goods ETF (XSNR). 

But I would be wary of continuing to chase large-cap dividend stocks and indices higher at this point, as many of these stable growth stocks are now sitting at relatively expensive valuations, particularly in the US.  

If you want to buy exposure to European dividends, it would perhaps be better to look at a high-yielding sector ETF that is performing well, such as the STOXX Europe Telecoms ETF (offered by db x-trackers, Lyxor amongst others) rather than chasing what seems to me to be expensive dividend growth, at this point.  

Friday, 11 October 2013

Banks Breaking Higher In Spite of US Political Roadblocks

Given the drag to US economic activity from the ongoing US government shutdown, and the looming need to raise the US debt ceiling (before the US government runs out of money!), I am surprised to see that US investment banks and broker-dealers continue to do very well, with hardly a pullback in sight. 


US Broker-Dealers Bounce off 3m Moving Average


Boosted by Retail Investors Buying Stock Funds

This particular index comprises investment banks such as Goldman Sachs and Morgan Stanley, stock and commodity exchanges such as the CME, ICE and NYSE Euronext, and electronic trading platforms with as TD Ameritrade and E*Trade. They are all clearly benefiting from the current bull market in stocks, and the swtch by retail investors away from bond funds back towards equity funds, e.g. in the form of buying equity ETFs. 


Money Still Flowing Into Equity ETFs

European Financials Lead the Stock Market

In Europe, the same trends can be seen, with both the European Banks and Insurance sectors at or breaking new highs:


European Banks break a new year high

European Insurers also hitting a new high
You might argue that financial markets are perhaps being a little too sanguine over the risk of a US government debt default; the accepted consensus seems to be that a US default would wreak complete havoc on the US and global economies (not to mention global financial markets), and thus will be avoided by a combination of the US Treasury and Federal Reserve at all costs. 

Nevertheless, the fact remains that volatility remains historically low in spite of the political deadlock, and investors are still stuck looking for somewhere to invest their savings where they can garner a half-decent return, which is still leading them back to stocks and shares. 


Implied Volatility Still Close to Multi-Year Lows

Personal caution

I personally would rather be a seller into this rally than a buyer, as I believe that any eventual debt ceiling deal in the US could result in the stock market cooling off, as it is often better to "buy on the rumour, but sell on the news"

That said, the US and European Banks and Insurance sectors still contain many companies that look attractively valued when looking at P/E, dividend yield or price/book valuation metrics, at a time when the US stock market overall could be argued to be already fully valued (as was argued recently by the famed investor Julian Robertson in a recent CNBC TV interview: Julian Robertson interview).

So what to do? I am still heavily invested in the UK, European, US and Japanese stock markets for now, but I must admit, I am looking to sell down positions sooner rather than later. After all, we are still not even halfway through the month of October, which has proven a pretty volatile month for stock markets in the past (see previous post for details)...

So invest in banks and insurers if you are confident of a successful resolution to the US debt ceiling issue, and if you believe that upcoming quarterly earnings releases from giant US banks such as JP Morgan and Wells Fargo will not disappoint expectations. 

Good luck,
Edmund

Monday, 9 September 2013

Back to School! What a relief! Japan, Small-Caps still motoring ahead

Back at the beginning of August, I noted how a number of clear investment trends were still in evidence, most notably:
  1. The outperformance of Small-Cap companies in the UK, Continental Europe and US;
  2. The stock market recovery in Japan following a sharp sell-off;
  3. The outperformance of the European Retail sector (largely supermarkets) versus the broad market.
Now post the Back-to-School period, where do we stand on these three trends?

1. Small-Caps: Still Breaking New Highs

UK, European and US small-cap indices continue to break new year highs, in the process outperforming benchmark indices in the various regions:

UK Small-Cap ETF Still Hitting New Highs, Beating FTSE 100 hands down

Given the strong rebound in economic indicators such as manufacturing confidence indices, I believe that this small-cap outperformance trend still has legs, and so I remain happily invested principally in UK small-cap companies like Tribal Group (TRB), Inland Homes (INL) and Sepura (SEPU).

2. Japanese stock market boosted by GDP growth, 2020 OIympic Games


The Japanese stock market story also remains intact, boosted by a surprisingly strong 3.8% GDP growth print for Q3 2013, and the awarding of the 2020 Olympic Games to Tokyo. 

Nikkei Index Maintains Health Lead Over MSCI World Index

Again, I remain firmly committed to the Japanese equity market story, and keep my MSCI Japan (GBP hedged) ETF (IJPH) for now.


3. Retailers Better Other Defensive Sectors, Overall Stock Market

And thirdly, the back-to-school period has led to healthy gains for the European Retail sector, most notably from supermarkets that tend to benefit from a boost in sales of school clothing and the required stationery for the new school year. In the process, retailers have left not only overall stock market indices for dead, but also other defensive sectors like Food & Beverages (see below). 


European Retail Far Outstrips the Defensive Food & Beverage sector

I remain a fan of a number of Retail stocks in the UK as a way of playing this bullish trend, including Sports Direct (SPD), Marks & Spencer (MKS) and Dixons (DXNS).

In the next posts, I will have a look at a number of new themes and trends, but for now, stick with these three good'uns. 

For now, as the French say, Bonne Rentrée (literally, "good back to school")!

Edmund


Sunday, 4 August 2013

Smallcaps forge ahead

Yet again, I am pleased to report that stock markets have made further progress through the month of July, led by smallcaps yet again. 

UK Smallcaps breaking new highs

Japanese stocks have also recovered to a surprising extent, with a promising uptrend looking to be re-established once again.

Nikkei index rebounds off the 100-day moving average

On the sector front, the Insurance and Retail sectors have shown the most resilience in recent weeks, surging to new 52-week highs and leading the way within European stock markets. This to some extent reflects the improving economic fundamentals in Europe, reflected in the surprising recent fall in the European unemployment rate and corporate reports of better European business activity.

European manufacturing activity is picking up


European Insurance sector maintains a strong uptrend

And Retail stocks are also threatening to set new highs too

Current Insurance stock favourites which offer a tempting combination of value (e.g. high dividend yield, low price/book value) include Delta Lloyd (DL), Aviva (AV) and AXA (CS). In Retail, I continue to favour UK mid- and small-caps such as Sports Direct (SPD), Darty (DRTY) and Inchcape (INCH).

Overall, while I remain cautious given the strong stock market advance since November of last year, there are several pockets of positive momentum that can still be exploited, in particular in the mid- and small-cap space. 

Best of luck, 
Edmund


Friday, 28 June 2013

Could we finally see the beginning of the so-called "Great Rotation"?

Up to now, there has been little real sign of the much-vaunted Great Rotation this year, supposedly out of bonds and into stocks & shares. It simply has not happened: judging by data on fund flows in the US and UK for this year, we have seen investors putting new money into BOTH stock and bond funds over the months up to April. 

So no sign thus far of any flight from bonds and into stocks, then. However, today I stumbled across this headline in the Financial Times:


With government bond yields rising sharply given the fears over central bank withdrawal of monetary stimulus, it is true that bond investors have had a rough time since early April, as can be seen from the chart of the UK gilt ETF below, whose price dropped from a peak of 1212p to just 1136p now, losing investors over 6% in the process. Given that UK 10-year government bonds yield 2.4% currently, that is a lot of money to lose in less than three months...

UK Gilt ETF Drops Sharply
Source: Bigcharts.com
Interestingly, a relatively defensive sector like Healthcare is roughly flat over the same period, not only offers a 4%+ dividend yield but also offers the prospect of dividend growth to boot, something that bonds can never offer. 

Which sectors can benefit from rising bond yields?

Historically speaking, when long-term bond yields have risen faster than short-term interest rates (in technical speak, a "steepening of the yield curve") as is happening now, the sectors that have outperformed have been:

1. Media
2. Autos
2. Mining

Well, clearly Mining is not working, as it is the worst-performing sector so far this year. However, Media is outperforming nicely, led up by TV, advertising and newspaper stocks (ProSieben Sat1, ITV, Daily Mail, WPP). 

Who gets hurt by rising bond yields?

Rising bond yields could spell trouble ahead for bond-sensitive sectors such as Utilities, Infrastructure stocks and Telecoms. 

A nice mixture of dividend yield (income) and dividend growth: Dividend Aristocrats

If you are a bond investor looking to rotate out of government or corporate bonds and want some easy stock income growth funds to buy instead, I would suggest that you have a look at the following two Dividend Aristocrat ETFs from State Street, based on S&P Dow Jones Indices:

1. SPDR Euro Dividend Aristocrats (EUDV)
2. SPDR UK Dividend Aristocrats (UKDV)

Both contain an interesting blend of dividend yield plus potential dividend growth, and tend to hold a lot of low volatility stocks, so should benefit over time from the better risk-adjusted performance of low volatility stocks versus the overall stock market. 

Interestingly, both have held up very well during the recent market volatility, and look ready to move higher once again:

UK Dividend Aristocrats regaining ground

Good luck and bon weekend!
Edmund


Surprisingly, Market Trend Indicators Still Largely Positive!

28/06/2013

Why I have not (yet) given up on stock markets for now

At times of volatility such as we have recently undergone, I find it helpful to consult a number of market trend indicators that have served me well in the past, and which have a relatively good track record in marking major trends in stock markets, plus potential turning points. 

I have three such indicators that I favour:

1.  The Cumulative advance-decline indicator (The balance between how many US stocks have advanced during a given day, minus how many stocks have fallen, added up day by day from early 1965).

2. The New 52-week highs-lows indicator (The balance between how many US stocks have hit a new 52-week stock price high, minus how many have hit a new 52-week low in a given day, added up from start in 2003). 

3. The High Beta/ Low Volatility oscillator (The S&P 500 High Beta index divided by the S&P 500 Low Volatility index), looking at this oscillator index versus its own 3-month moving average. 

In each case, if the indicator is above its own moving average, then it gives a positive signal for stocks, if below then it gives a negative signal (meaning you should prefer bonds or cash to stocks). 

What do these three indicators flag up as of yesterday?

1. Advance-Decline: Still Positive for Stocks

2. New Highs/New Lows: Also Still Positive for Stocks


3. High Beta/Low Vol: Still Thumbs up for Stocks
Source: Unicorn, S&P Dow Jones Indices


Conclusion: Despite the rocky ride in stocks, bonds and even precious metals over the last few weeks, the current uptrend in stock markets does not look to be over just yet, at least according to these three trend indicators. 

Which sectors to prefer?


The four European stock market sectors still showing good relative strength (i.e. which are still outperforming the overall stock market) remain:

1. Healthcare (e.g. Roche, Sanofi)
2. Technology (e.g. Nokia, Alcatel)
3. Media (e.g. ProSieben Sat1, )
4. Insurance (e.g. Aviva, Delta Lloyd)

However I would be very wary of sectors which have les the stock market lower over the last few weeks, including:

1. Utilities (particularly electricity-related stocks)
2. Oil & Gas
3. Mining
4. Banks

Regional Preferences: Italy and Spain look vulnerable

And on a regional front, peripheral Europe is once again underperforming as their bond spreads over core Europe widen out once again, so be careful of:

1. Italy
2. Spain

On the other hand, Ireland continues to show impressive stock market outperformance, so I would stay with Irish stocks such as Ryanair and Greencore. 


Tuesday, 25 June 2013

Well what a torrid week! Has the bond market definitively cracked? What next...

25/06/2013  A Tough Week for Investors

After a torrid week for pretty much all financial assets (stocks & shares, bonds, precious metals...), we can perhaps let the dust settle to see where we really are. 

Central banks have clearly dominated the investment landscape, with mounting fears over the US Federal Reserve starting to "taper" their reinvestment of cash in US government Treasury bonds some time from September this year, and also the People's Bank of China tightening up on credit standards in order to cool the growth in credit there. 

Volatility has awakened, but not yet near 2012 highs

The volatility in equity markets has evidently spiked as a result of the drop in stock and bond prices over the week, with the 3-month implied volatility level on the US S&P 500 index back up above 20 as of yesterday. 


S&P 500 3-month implied volatility back above 20, 
but still a long way from 2012's highs
Source: St. Louis Fed

Bond markets have been hit by the central bank fallout

Bond markets have clearly suffered too, with bond yields rising (and thus bond prices falling) to their highest levels this year. This fact has prompted many calls for the end of the 30-year bond bull market, with some even declaring the arrival of "a lost decade" for bond investors, i.e. a decade where bonds will make no money at all for investors. 


Yes European bond yields have risen, but are still very low by historical standards
Source: iShares/Blackrock

That said, let's not lose sight of the fact that the interest rate effectively paid by large European companies to borrow money over a number of years in the bond markets remains, at an average of only 2.3% for investment-grade companies and 4.2% for high-yield rated companies, still close to record lows. Thus while I DO believe that the majority of government and corporate bonds represent fairly poor value right now, I would not think that the rise in yields that we have witnessed recently is in any way catastrophic for investors or indeed, for the wider economy. 

Some sectors look ugly...

Within the European stock market, there are a few industries/sectors that are in a clear down trend, most notably those sectors linked to commodities, like the Oil & Gas sector and Mining:


Oil & Gas (SXEP) has been trending down for the past year...

 As has the Mining sector (SXPP)
Source: bigcharts.com


But at the same time, not all is lost for the stock market investor! There aare still quite a number of industries that look promising to those looking to invest on this market correction, including various areas of technology such as Semis and Nokia:

Semiconductors are just pulling back to a clear support level...

 Nokia is slowly recovering too
Source: bigcharts.com

And don't give up on Japanese equities either just yet...

The Japanese Nikkei index is starting to recover after a sharp sell-off
Source: bigcharts.com

All in all, the so-called carry trade (explanation here: WSJ: The carry trade ripping across Wall Street) has been unwinding at a rate of knots as worried investors retreat from equity, bond and precious metal investments in the wake of Fed President Bernanke's recent pronouncements. 

However, think of this: the higher that US government bond yields go, the higher that long-term fixed mortgage rates also go, potentially stalling both the US housing market recovery and US consumer confidence, in the process hurting US economic growth at a time when it is still relatively fragile. 

So, the higher that bond yields rise off the back of the fear of the Fed withdrawing monetary stimulus support for the US economy, the more likely it becomes that the Fed has to keep all of the monetary stimulus in place to prop up faltering economic growth as US housing weakens. All in all, judging by economic indicators such as the rate of employment growth, the ISM manufacturing survey and capital spending growth, the US economy is not at all in a robust growth mode right now (see for instance, What's Capping Capital Spending?). 

Conclusion

Stock markets in Europe have pretty much now given back all of their gains for this year to date (although not so bad for mid-caps), offer good value in terms of P/Es and dividend yields, and may now be stabilising. Investors need to be selective about which sectors to put their money into from here, particularly given that May has passed and we are now in what is traditionally the poorer 6-month period (June-October) from the point of view of stock market returns. 

I would personally stick with Technology, Healthcare, Luxury Goods and Insurance, but would avoid the likes of Oil & Gas, Mining, Utilities and Food & Beverages (all of which have ugly-looking 1-year charts). 

Edmund