Showing posts with label momentum. Show all posts

Wednesday, 14 October 2015

Budget airlines EasyJet and Ryanair soar toward investment success

IBTimes UK web link to article, video:


I recently flew back from Geneva to Paris after a long day of meetings with clients. But I didn't fly with either of the two flag-carrier airlines, Air France or Swiss. Instead, I chose to fly with EasyJet, in the process saving my employer hundreds of euros.

While I did arrive 15 minutes late in Paris, due to the airplane being late to arrive in Geneva in the first place, something else struck me. I was amazed at how full the flight was, with hardly a spare seat left on the aircraft. No chance of me getting the aisle seat I prefer.

What is more, so many people had opted, like me, to pay extra for speedy boarding in an effort to get a seat near the front of the aircraft, that in the end it didn't offer much of a benefit. Except to EasyJet of course, who made more money out of all of us.

That set me thinking – how well is the distinctive orange-liveried airline performing this year? Digging into the monthly passenger traffic statistics from the EasyJet website, the answer seems to be that they are doing very well indeed.

EasyJet enjoys strong passenger growth

Every month this year, EasyJet (UK code EZJ) has carried more passengers in Europe than over the same month in 2014

 For the first 9 months of the year, EasyJet has on average carried 6.5% more passengers than over the same period in 2014.

Clearly, with Ryanair also carrying a record number of passengers in 2015, budget airlines are enjoying a banner year on the back of strong consumer confidence and a stronger pound sterling, which has improved British tourists' purchasing power abroad.

EasyJet's aircraft are fuller than ever

Profit growth isn't just about how many passengers are carried per year; what is at least as important is how full each flight is. This is expressed as 'load factor' - the percentage of an aircraft's seat capacity that is filled by a paying passenger.

In the case of EasyJet, the load factor is also improving this year over 2014: each month since March, EasyJet's load factor has been higher than the corresponding month in 2014. So EasyJet's profits this year should be better than last year's, not only because they are carrying more passengers, but also because each aircraft is on average fuller than last year.

Analysts following EasyJet are forecasting 20% earnings growth for this year, followed by 9% further growth in 2016.

Is EasyJet the only choice in budget airlines?

An investor who wants to capitalise on the growth in budget air travel across Europe actually has a number of investing options apart from EasyJet:

  • Ryanair (UK code RYA) is the biggest budget airline in Europe by number of passengers carried. They claim to be the first airline to have carried over 10 million international passengers in one month, achieved in July 2015. They also achieved a record load factor in July of 95%.
  • Wizz Air (UK code: WIZZ) is a budget airline that is listed on the London Stock Exchange, and which focuses on no-frills flights out of London Luton to Eastern Europe, including to Poland and the Czech Republic. This is a growth market given the large growth in UK immigration from Poland, Romania and other recent entrants to the European Union over the last few years. They carried nearly 2 million passengers in July 2015, and are seeing 20% year-on-year passenger growth this year.
  • Air Berlin, listed in Germany, is a low-cost German airline operator. However, unlike Ryanair and EasyJet, Air Berlin is struggling against Ryanair, EasyJet and Lufthansa, and is projected to make a loss this year.
  • Norwegian Air Shuttle, listed in Norway, is a low-cost airline operator that not only operates low-cost flights to and from Scandinavia within Europe, but which also operates long-haul budget flights to New York from London Gatwick. So next time you want to spend a long weekend in the Big Apple on the cheap, look up www.norwegian.com!

A final note on EasyJet: not only is it cheaper on valuation than either Ryanair or Wizz Air, but it also offers a decent 3.7% dividend yield and is sitting on over £400m of cash - both good supports to the share price. While normally I am not a fan of investing in airline shares, I would make an exception for EasyJet.

Edmund

Monday, 7 July 2014

Want High Yield and Momentum? Go for Insurance!

Time to Love Non-Life Insurance

One of the key investment themes that I continue to champion is that of the "Hunt for Yield". Here we are, in a period where global central banks are conspiring to keep short- and long-term interest rates as low as possible in order to shore up what is fragile economic growth in the "New Normal" of a post-crisis Developed World. 

At a time when government bonds, and even investment-grade corporate bonds, are no longer offering anything like attractive yields to maturity, where can income investors turn? One solution is to subscribe to Neil Woodford's new fund, which unsurprisingly is stuffed yet again with AstraZeneca (LON:AZN), GlaxoSmithKline (LON:GSK) and tobacco companies like Reynolds American, as it was back in his old funds at his former employer Invesco Perpetual. 

I prefer a stock-picking approach, focusing on sustainable value and momentum. Within the UK stock market, the sector that looks best placed on these metrics is the UK non-life insurance sector, containing such high yield gems as Brit (LON:BRIT), Amlin (LON:AML) and Catlin (LON:CGL) within the Lloyds of London reinsurance segment, and the RBS spin-off Direct Line Insurance (LON:DLG) in more classic Property & Casualty insurance. 


High and Sustainable/Growing Yields

Each of these four insurers offer prospective dividend yields in excess of 5%, up to 10% in the case of recently refloated Brit (LON:BRIT). 

Dividend payout ratios are of the order of 60% except in the case of Brit (LON:BRIT), and Returns on Equity are typically between 10% and 13% this year and next. All of which suggests that not only are these high dividend yields sustainable (except in the case of a sharp unexpected drop in earnings), but that long-term dividend growth should be in the region of 4-6% going forwards. Perhaps not exceptional, but certainly more than enough to compensate for inflation.  


Value aplenty too

To read the rest of this article, please click on the web link below:


Thursday, 5 June 2014

Asos – a timely reminder of the dangers of “glamour” stocks and four with more appeal

Okay, let’s start with a quick disclaimer: as a fund manager, I admit that I have a bent towards stocks that display a combination of value (cheap), quality (profitable) and momentum (prices moving higher) characteristics. So given Asos’ (code: ASC:L)  lofty 2014 forecast P/E ratio of 77x as of yesterday, it was clearly never going to be one of my favourites.

A quick glance at Asos’ long-term weekly chart (Figure 1) tells you why this online fashion retailer has long been a favourite of retail investors, with a share price that multiplied by over 15 times from a low around 430p in early 2010 to a high of over £70 hit in March this year.


1. THE METEORIC RISE OF ASOS SINCE 2010

Source: Bloomberg


So what does today’s profit warning tell us?

Asos has today informed the market that sales growth is slowing and, even more importantly, that profit margins will be a lot lower than expected (4.5% rather than around 6.5%). This follows a warning in March that earnings would be impacted this year by increasing levels of investment.

Today’s warning has now taken Asos’ share price down to around £31 at time of writing (Figure 2), less than half of its March peak but still representing a 2014e P/E valuation of 52x, before the analysts even take out their red pens and cut their earnings forecasts. So in reality, Asos’ valuation will turn out to be far higher than 52x… This at a time when the overall UK stock market is rated at 14x this year’s earnings, falling to 12.8x for 2015.


2. ASOS HAS COME DOWN TO EARTH WITH A BIG BUMP SINCE MARCH…


The lesson to be learned here is that blindly following momentum is a dangerous strategy, once that momentum has turned. Remember that following the first warning from Asos in March, the share price had already fallen from over £70 to a mid-May low of £38.50. Investors had been given plenty of fair warning to sell their stocks at a level far higher than today’s £31…


To read the rest of this article, including the strategy and 4 stocks I would look at instead of Asos, please click on the web link below:


Wednesday, 2 April 2014

Three stocks to profit from a value rotation

Momentum takes a beating, Value remains near highs

So it is true: what goes up quickly, can also come down quickly! The month of March has seen US momentum stocks fall sharply, while in contrast value stocks have held up very well. 

Figure 1 shows that momentum stocks (the line in black) have hardly outperformed value stocks (the line in yellow) over the last half-year, after a torrid month of March.

1. MOMENTUM STOCKS TAKE A HIT, VALUE HOLDS UP WELL

Source: Bloomberg


Three sub-sectors in particular have been hard-hit (Figure 2):
  1. Biotech has lost 13% from its high at in February (line in yellow);
  2. Social media stocks such as Facebook and Twitter have lost 14% in aggregate from their peak (line in green);
  3. Recent IPOs retreat 6% from the peak, judging by the First Trust US IPO ETF (FPX; line in black).
2. BIOTECH, SOCIAL MEDIA AND IPOS CAUGHT IN THE MOMENTUM RETREAT

Source: Bloomberg

Yield back in vogue

Long-term government bonds have performed well of late. Both European and US long-term government bond funds have gained significant ground over the year-to-date. This, in spite of the poor yields being offered by both (2.1% for a UK Gilt ETF; 3.1% for a US 20+ year Treasury bond ETF).

We can see that yield is becoming very popular once again as an investing strategy; this is evident from the recent performance of both US high yield corporate bonds (in black) and also US real estate trusts (REITs; in orange)...
 
To read the rest of this article, please click on the Mindful Money link below:


Happy value hunting!
Edmund

Wednesday, 26 March 2014

Is India the First among Emerging Market Equals? Time to buy?

Astute observers will have noticed that the Indian Sensex index has just hit a multi-year high at over 22,000 (Figure 1).


1. THE INDIAN SENSEX INDEX HITS A NEW MULTI-YEAR HIGH


Source: Bloomberg

Not only that, but the Indian rupee has also started to gain ground against major currencies such as the US dollar, the euro, and sterling.

Given the relatively poor backdrop for most emerging markets thanks largely to Russia and China, why is India bucking the trend so successfully?


New central bank governor, maybe a new government?

A widely respected central bank governor, Raghuram Rajan, has already been installed at the Reserve Bank of India. He has lent a lot of credibility to the central bank policy of attempting to control Indian inflation which is still relatively high at 8.1%, but which is finally starting to come down.

A second driver for a positive view on India comes from Indian politics. Parliamentary elections are due to be held soon in India, and current opinion polls indicate that Narendra Modi’s Bharatiya Janata (BJP) opposition party is likely to win power, ousting the long-serving Congress party in the process. This is being seen as a good opportunity to see widespread reform within India, which may remove some of the structural roadblocks to Indian growth.

Clearly, while it is not clear that tensions over the Russian annexation of Crimea are calming or that sanctions will not be intensified on the part of the US and European Union, and while it is not clear as well that China will reignite growth in the near future, nevertheless India remains a bright spot within the emerging market universe.


Please click on the web link below to read the rest of the article and see the
ETFs and investment trusts recommended:  


All the best, 
Edmund 

Monday, 20 January 2014

Rio Tinto: Mining for value

Over at least the past decade, UK-listed mining stocks such as Rio Tinto (RIO) have been tightly correlated with two key financial asset classes:

Industrial commodities (industrial metals such as copper, nickel and aluminium and coal for making steel) and Emerging markets such as the Brazilian, Russian, Indian and Chinese (BRIC) stock markets, as well as the Australian stock market (which is itself heavily-weighted towards mining stocks).

The reason for this is clear: the main sources of growth in demand both for these industrial metals and for coal have been China and India, as they have expanded their heavy manufacturing bases to become the world’s centres for all types of manufactured goods, from white goods to toys.

Nothing new or particularly interesting to note so far. Recall that the worst-performing major regional stock markets over 2013 were indeed Emerging Markets; and that one of the worst-performing industrial sectors in the UK stock market last year was the Mining sector, both driven by concerns over slowing growth in the major BRIC economies.

But Rio Tinto is Now Diverging from Emerging Markets

However, now for a more interesting and perhaps less obvious fact: Since the middle of last year, the major UK-listed diversified mining company Rio Tinto has managed to de-correlate from the poor trend in emerging market stocks.

To read the rest of this article and see the associated graphs, please click on the link below to my "Expert Opinion" page on the MindfulMoney website:


Happy digging, 
Edmund

Friday, 10 January 2014

Clean energy has the solar wind in its sails

In hunting around for investment themes for 2014, you could do worse than look to what has already performed well through 2013. Remember, momentum tends to be persistent in financial markets, i.e. unlike the effect of gravity in the physical world, in stock markets what goes up tends to keep on going up.

One of the hottest investment themes of 2013 was Clean (or Renewable) Energy. In the US, the Guggenheim Solar ETF (code TAN) gained 125% over calendar year 2013, while the First Trust Global Wind ETF rose 64%. Could this stellar performance possibly be repeated this year?

 2014 Trend number 2: Clean Energy Gathers Ever More Momentum

The first question that needs to be answered is of course: what is driving these solar and wind energy stocks up? The simple answer is a combination of two factors:

Please click on the Mindful Money web link below to read the rest of the article, including potential ways to invest in this theme:


Take advantage of this following wind for your investments!
Edmund

Monday, 23 December 2013

Unlocking Hidden Small-Cap Value in Marwyn Value Investors

One of my favourite hunting grounds for stocks that offer deep value is the small-cap and micro-cap segment of the UK stock market. We can define stocks as small-cap if they belong to the FTSE UK Small-Cap index (over 500 constituents of stocks whose market is typically smaller than those in the FTSE 100 or FTSE Mid 250 indices). Micro-caps typically belong to the FTSE Fledgling index or the AIM market.

Unlike many other stock markets around the world, the UK offers a broad and rich variety of small- and micro-caps that are liquid enough to trade without suffering bid-ask price spreads that are very wide, as long as you are patient when accumulating a significant holding. Typically, these companies are not covered by mainstream investment banking research analysts, and are often simply too small to interest most professional fund managers, who tend to invest in more liquid companies. It is precisely for these reasons that we are able to uncover very interesting value and growth investment stories in this arena. Academically speaking, small- and micro-cap stocks should outperform large-cap stocks in the long-term due to the existence of an “illiquidity premium”, i.e. an investor should be compensated for the risk of holding a stock which he or she cannot sell quickly by superior long-term investment returns from this type of stock.

I believe that one such interesting company is a closed-end fund company called Marwyn Value Investors (MVI). This company, listed on AIM, has a current market capitalisation of £119m (as of 18 December 2013). According to the company’s website (www.marwynvalue.com), this fund “participates in acquisition-led growth strategies by investing in diversified portfolio of European small- and mid-cap businesses”.

Read the rest of my article on Marwyn Value Investors by clicking on this link below to my MindfulMoney article:


Happy reading! And have a very merry Christmas and New Year.

Edmund


Wednesday, 4 December 2013

Weekly Global Strategy Screencast: Where are the Financial Markets Headed?

Where are the Financial Markets Headed?December 2013 

This week, I have recorded a screencast of my monthly presentation looking at where my essential financial market indicators are pointed (stock markets, credit markets, financial risk, fund flows etc.). 

Please click on the Youtube link below to watch my 4:30 minute slide presentation with audio commentary (best viewed in fullscreen mode):


Alternatively, you can click on the video below if you don't mind watching the video in a smaller window:


Punchline: Most of my indicators remain positive for risk markets including stock markets for this month.

Happy watching!

Edmund

Friday, 29 November 2013

Weekly Global Strategy Screencast: Playing "The Internet of Everything" investment theme

Screencast: Playing "The Internet of Everything" investment theme

In this week's animated presentation with audio commentary, I take a look at how to play the "Internet of Everything" investment theme, without falling into the trap of paying very high valuation multiples for social media and e-commerce stocks, i.e. the likes of Facebook, Amazon.com and Linkedin.com. 


Or simply click to watch the video (small window size) below:


For an introduction to the Internet of Everything, watch the Youtube videos below:


Happy investing!
Edmund


Tuesday, 1 October 2013

Should we invest in Stocks in October, Despite Seasonal Risks?

Stay in Stocks in October?

There are a number of reasons for avoiding risky assets like stocks in the month of October, ranging from seasonal to geopolitical to fundamental:

  1. Seasonal: Historically, September and October have traditionally been the most volatile months of the year for stock markets worldwide, the months when most sharp stock market falls have been recorded (think Sept-Oct. 2001, Sept-Oct. 2008). Yes, stock markets have generally made small advances over the month of September, and have done well over the year to date. But isn't that precisely the reason for locking in profits now, at the beginning of October?
  2. Political: The partial US government shutdown over the lack of agreement between the Democrats and Republicans over a the US budget could cause further volatility in the US economy and thus in financial markets. Thus far, markets seem to have taken these events in their stride (VIX volatility index close to a year low at under 15), but can we expect this relative calm to persist if no agreement is reached soon?
  3. Fundamental: Let's not forget that the US Federal Reserve, having positively surprised the markets by not beginning the infamous "taper" (i.e. not reinvesting the proceeds of maturing bonds back into the US bond market) in September, could nevertheless begin this tapering process very soon. This was even hinted at by St. Louis Fed President James Bullard, who intimated that the taper might even begin in October (i.e. this month!). So the relief rally we have seen in bonds may not last much longer...

But some reasons to stay the course with stocks (for now)

A key reason to remain invested in stocks at the beginning of October is the basic fact that established uptrends in the major US, European and Japanese stock markets remain intact. Each stock market sits above its own 3-month and 6-month moving averages, and has not broken the general pattern of higher highs and higher lows. 

EuroSTOXX index in clear uptrend
Secondly, while it is true that September and October have contained some painful periods of stock market falls, we should not ignore the fact that, on average, the UK stock market has generated an average 2.1% total return (price change + dividends) over the two-month period over the 23 years from 1990 to 2012. 

UK stock market has gained 15 times out of 23 Sept+Oct periods

Indeed, over the past four years we have seen positive 2-month returns on each occasion... So from this simple statistic, I would say that the jury is out on whether these months should be completely avoided or not. 

Be pragmatic, use a stop-loss!

My pragmatic approach to investing in stocks at this time of year is relatively simple: I favour using liquid index-based ETFs rather than individual stocks, as then I can easily manage the level of risk in my portfolio by selling or reducing only a few investments. I also put in place a relatively tight stop-loss, so that I reduce my stock market investments before losses become painful. 

But, for this month of October, my ETF-based investment strategy is 100% invested in stocks, via UK Small-Caps (ETF code: CUKS), Euro Low Volatility stocks (IMV), US Small-Caps (ISP6), Emerging Markets Low Volatility stocks (EMMV) and FX_hedged Japanese stocks (IJPH). But in each case, I will be closely monitoring weekly moves, and selling them if they exceed the stop-loss levels I have set in place as of today. 

Year-to-date performance of my re-christened STAS

On a final note, I just wanted to point out that my asset allocation trending system STAS (Signal-driven Tactical Allocation System) has now gained 15.1% net of costs over the year to the end of September, including a monthly gain of 1.3% for September alone despite being 40% invested in cash. So far, still so good...


Monday, 9 September 2013

Back to School! What a relief! Japan, Small-Caps still motoring ahead

Back at the beginning of August, I noted how a number of clear investment trends were still in evidence, most notably:
  1. The outperformance of Small-Cap companies in the UK, Continental Europe and US;
  2. The stock market recovery in Japan following a sharp sell-off;
  3. The outperformance of the European Retail sector (largely supermarkets) versus the broad market.
Now post the Back-to-School period, where do we stand on these three trends?

1. Small-Caps: Still Breaking New Highs

UK, European and US small-cap indices continue to break new year highs, in the process outperforming benchmark indices in the various regions:

UK Small-Cap ETF Still Hitting New Highs, Beating FTSE 100 hands down

Given the strong rebound in economic indicators such as manufacturing confidence indices, I believe that this small-cap outperformance trend still has legs, and so I remain happily invested principally in UK small-cap companies like Tribal Group (TRB), Inland Homes (INL) and Sepura (SEPU).

2. Japanese stock market boosted by GDP growth, 2020 OIympic Games


The Japanese stock market story also remains intact, boosted by a surprisingly strong 3.8% GDP growth print for Q3 2013, and the awarding of the 2020 Olympic Games to Tokyo. 

Nikkei Index Maintains Health Lead Over MSCI World Index

Again, I remain firmly committed to the Japanese equity market story, and keep my MSCI Japan (GBP hedged) ETF (IJPH) for now.


3. Retailers Better Other Defensive Sectors, Overall Stock Market

And thirdly, the back-to-school period has led to healthy gains for the European Retail sector, most notably from supermarkets that tend to benefit from a boost in sales of school clothing and the required stationery for the new school year. In the process, retailers have left not only overall stock market indices for dead, but also other defensive sectors like Food & Beverages (see below). 


European Retail Far Outstrips the Defensive Food & Beverage sector

I remain a fan of a number of Retail stocks in the UK as a way of playing this bullish trend, including Sports Direct (SPD), Marks & Spencer (MKS) and Dixons (DXNS).

In the next posts, I will have a look at a number of new themes and trends, but for now, stick with these three good'uns. 

For now, as the French say, Bonne Rentrée (literally, "good back to school")!

Edmund


Sunday, 4 August 2013

Smallcaps forge ahead

Yet again, I am pleased to report that stock markets have made further progress through the month of July, led by smallcaps yet again. 

UK Smallcaps breaking new highs

Japanese stocks have also recovered to a surprising extent, with a promising uptrend looking to be re-established once again.

Nikkei index rebounds off the 100-day moving average

On the sector front, the Insurance and Retail sectors have shown the most resilience in recent weeks, surging to new 52-week highs and leading the way within European stock markets. This to some extent reflects the improving economic fundamentals in Europe, reflected in the surprising recent fall in the European unemployment rate and corporate reports of better European business activity.

European manufacturing activity is picking up


European Insurance sector maintains a strong uptrend

And Retail stocks are also threatening to set new highs too

Current Insurance stock favourites which offer a tempting combination of value (e.g. high dividend yield, low price/book value) include Delta Lloyd (DL), Aviva (AV) and AXA (CS). In Retail, I continue to favour UK mid- and small-caps such as Sports Direct (SPD), Darty (DRTY) and Inchcape (INCH).

Overall, while I remain cautious given the strong stock market advance since November of last year, there are several pockets of positive momentum that can still be exploited, in particular in the mid- and small-cap space. 

Best of luck, 
Edmund


Friday, 28 June 2013

Surprisingly, Market Trend Indicators Still Largely Positive!

28/06/2013

Why I have not (yet) given up on stock markets for now

At times of volatility such as we have recently undergone, I find it helpful to consult a number of market trend indicators that have served me well in the past, and which have a relatively good track record in marking major trends in stock markets, plus potential turning points. 

I have three such indicators that I favour:

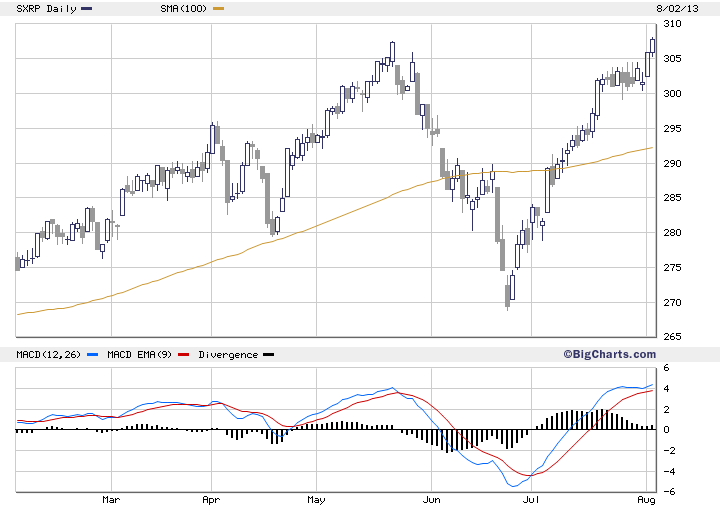
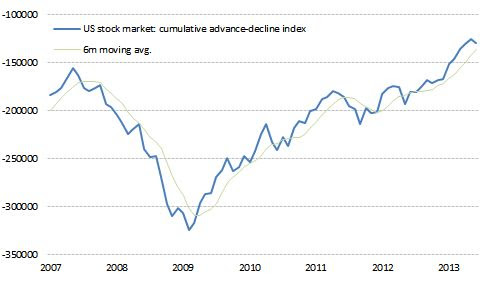
1.  The Cumulative advance-decline indicator (The balance between how many US stocks have advanced during a given day, minus how many stocks have fallen, added up day by day from early 1965).

2. The New 52-week highs-lows indicator (The balance between how many US stocks have hit a new 52-week stock price high, minus how many have hit a new 52-week low in a given day, added up from start in 2003). 

3. The High Beta/ Low Volatility oscillator (The S&P 500 High Beta index divided by the S&P 500 Low Volatility index), looking at this oscillator index versus its own 3-month moving average. 

In each case, if the indicator is above its own moving average, then it gives a positive signal for stocks, if below then it gives a negative signal (meaning you should prefer bonds or cash to stocks). 

What do these three indicators flag up as of yesterday?

1. Advance-Decline: Still Positive for Stocks

2. New Highs/New Lows: Also Still Positive for Stocks


3. High Beta/Low Vol: Still Thumbs up for Stocks
Source: Unicorn, S&P Dow Jones Indices


Conclusion: Despite the rocky ride in stocks, bonds and even precious metals over the last few weeks, the current uptrend in stock markets does not look to be over just yet, at least according to these three trend indicators. 

Which sectors to prefer?


The four European stock market sectors still showing good relative strength (i.e. which are still outperforming the overall stock market) remain:

1. Healthcare (e.g. Roche, Sanofi)
2. Technology (e.g. Nokia, Alcatel)
3. Media (e.g. ProSieben Sat1, )
4. Insurance (e.g. Aviva, Delta Lloyd)

However I would be very wary of sectors which have les the stock market lower over the last few weeks, including:

1. Utilities (particularly electricity-related stocks)
2. Oil & Gas
3. Mining
4. Banks

Regional Preferences: Italy and Spain look vulnerable

And on a regional front, peripheral Europe is once again underperforming as their bond spreads over core Europe widen out once again, so be careful of:

1. Italy
2. Spain

On the other hand, Ireland continues to show impressive stock market outperformance, so I would stay with Irish stocks such as Ryanair and Greencore. 


Thursday, 13 June 2013

Après le Déluge... What to do now?

13/06/2013 

Après le Déluge...

What do do now after what has been an impressive spike in volatility across financial markets over the last few weeks? 

First of all, DON'T PANIC! 
After such a good start to the year in risky assets like equities, it is hardly surprising that markets have corrected somewhat. Let us not forget one salient fact: that we are NOT in a normal market environment, with interest rates and liquidity manipulated by central banks globally in the aftermath of Financial Crisis...

So where should we be looking to invest? Certainly, no-one wants to be "catching a falling knife", i.e. investing in shares or bonds, just to see them sink even further straight away...

US S&P 500 index has not broken any support levels - still in an uptrend

If the most recent horizontal support line (on the top right of the chart above) holds for the S&P 500 index, then we will likely make further gains and potentially new year highs, not just in US equities but also in Europe. 

What I like right now

My personal strategy is to continue to buy selected stocks that are:

a. Relatively good value in fundamental terms (a good dividend yield, moderate P/E, low price/sales or low price/book) 

b. with decent profitability (e.g. judged on return on capital employed), and 

c. most importantly whose share price has recently broken to new multi-year highs, thus showing strong price momentum. 

I prefer stocks that have also recently reported strong or encouraging financial results, thus where the strong price momentum is supported by improving profit momentum.

I am looking at sectors and investment styles that continue to exhibit relative strength (i.e. that continue to outperform the benchmark indices like the FTSE 100 or Euro STOXX 50), including but not limited to stocks in the UK small-cap, European Healthcare and US Technology spaces:

  • British Polythene (BPI: UK small-cap)
  • Creston (CRE: UK small-cap)
  • Inland Homes (INL: UK small-cap)
  • Glaxo SmithKline (GSK: Healthcare)
  • Tribal Group (TRB: UK small-cap)
  • Hewlett Packard (HPQ: Technology)
  • Alcatel-Lucent (ALU: Technology)
  • Merck (MRK: Healthcare)
  • Sanofi (SAN: Healthcare)


What to buy if/when stock markets clearly rebound

I would add a number of other regions and sectors to look at once stock markets start to show clear signs of rebounding:

  • Japan (e.g. the iShares MSCI Japan yen-hedged ETF - IJPH)
  • Insurance (e.g. Munich Re, Delta Lloyd)
  • Asset managers (Aberdeen, Man Group)
  • Broker/dealers (IG Group, ICAP)


All of these regions/sectors show clear medium-term share price uptrends, but are clearly geared to the general level of risk tolerance of investors. As investors get more confident on the rebound in stock markets, these four areas should all benefit to a greater extent. 

Sectors I would avoid

There are a number of sectors which I think remain vulnerable to the threat of slowly rising bond yields, or which may well suffer worsening profit outlooks due to difficulties/disappointments in home markets or even in emerging markets:

  • Food & Beverage (Tate & Lyle, Heineken)
  • Utilities (National Grid, SSE)
  • Telecoms (Vodafone, KPN, Telefonica)
  • Mining (Anglo American, Glencore)
  • Disruptive technology shifts (ARM, Imagination Technologies)


Overall, I remain a keen trend-follower in terms of methodology, and on top of that I believe that central banks overall will be adding rather than pulling back on monetary stimulus (ECB, Bank of Japan in particular). On this basis, then, I think that stock markets have a much better chance of recovering substantially from here at least close to year highs, rather than falling much further. 

Good luck out there!

Edmund