Showing posts with label indicators. Show all posts

Tuesday, 7 October 2014

‘Tis The Stock Market Season to be Jolly

“Be greedy when others are fearful” 

This quote from one of the most famous investors of our age, Warren Buffett, is one to remember when confronted by a sharp sell-off of the sort that we have witnessed over the last four weeks. 

Challenging a 14-year High

In early September, the FTSE 100 index stood a fraction below the 7000 level, finally a hair’s breadth away from setting a new all-time high (the current all-time high is 6950, set back in late 2000). 

Now here we are in early October, braving the onset of Autumn and cooler temperatures, with stock markets globally also seemingly affected by a similar cooling. The FTSE 100 is now sitting around 6500, roughly 7% lower than a month ago. 

This sharp reversal, triggered by fears over weakening global growth and with the prospect of the US Federal Reserve raising interest rates on the other side of the Pond, has investors scurrying for the relative safety of bonds. According to the Investment Company Institute (www.ici.org), US retail investors have taken a net $2.6 billion out of stock funds and put over $4 billion into bond funds in the month of September. 

Don’t follow the herd and stampede out of shares

Rather than follow this herd, which has typically been late to invest in stock market uptrends and also late to exit stock markets one they have already fallen far, my contrarian instincts tells me to buy into the stock market now, on the basis that one should always be aiming to “buy low and sell high”. 

Several stock market sectors such as Oil & Gas and Food Retail have already suffered heavy falls and are now beginning to rebound. Valuation is relatively attractive too, with the FTSE 100 trading at a 12.5x P/E and paying out a dividend yield only a whisker under 4%. That’s not far off twice the paltry return that you will get for buying the UK government’s 10-year IOUs (I mean government bonds) right now! And even if the International Monetary Fund was relatively downbeat about global economic growth prospects, it was at least positive about the UK…

The Halloween Effect Could Strike (Again)

Let’s not forget about seasonal effects too. The Halloween effect, describing the traditional outperformance of stock markets globally from November through to April, is close to starting. In fact, my own research indicates that a better starting seasonal date for being invested in stocks in developed markets like the UK and US is actually mid-way through October. 

From mid-October through to the end of April, the FTSE 100 has gained an average of nearly 8% per period since 1986 (when the FTSE 100 began). This is the vast bulk of the average 9.5% yearly gain in the FTSE 100 (dividends included), and beats the average May-mid-October period performance of only 1.8% hands down (Chart 1). 

Chart 1: The Halloween Indicator Works Well in UK Stocks

Source: Author, Bloomberg

Follow the Value and Seasonal Trend in the FTSE

The current relative value (comparing the FTSE 100 dividend yield to bond yields) and the positive seasonal effect both argue that we should not overreact to the doom and gloom that surrounds investors at the moment, but rather that we should add exposure to the FTSE 100 in preparation for the strongest stock market half-year. In fact you could argue that this September sell-off could in fact be Christmas come early for the contrarian investor!

Edmund

Saturday, 8 February 2014

The Idle Investor Weekly Newsletter: 8 February 2014

Market Outlook: Are We Already Back to the Races?

As per the usual script, this recent stock market correction was unexpected and sudden on the downside, illustrating once again that while stock markets may go up steadily, they tend to drop out of bed quickly and without much warning, catching the majority of investors by surprise.

And just as everyone starts to panic and sell any exposure they have to Emerging Markets (which have suffered mutual fund huge outflows in the US over the month of January), stock markets in the US and Europe have started to recover, and volatility has started to go back down. The US VIX volatility index (commonly known as the “Fear index”) has already eased back to just over 15, after rising from 12 to a peak of over 21 (Figure 1).


1. The US VIX Volatility Index Is Receding Quickly


Even some of the worst-affected emerging markets such as Russia have even some measure of stability return to their currencies, after suffering a sharp bout of depreciation against the US dollar. 

Is this a buying opportunity, or is it too early?

This is a fair question. I would suggest that the issues that triggered the turmoil in emerging markets are far from being solved.

However the structural issues facing countries such as Turkey and Brazil are far from being as serious as those faced by Asian economies or Russia back in the crises of 1997 and 1998. 

Personally, I would not be buying into emerging markets just yet despite the compelling value they seem to offer, as they can always get cheaper still in the short-term, as has been pointed out by Templeton’s famed emerging markets guru Mark Mobius. On the other hand, developed stock markets such as the UK and Continental Europe do look attractive to me post their recent declines, as do certain US stock market sectors such as Oil Services. 

If you are determined to buy some cheap emerging market exposure as a committed long-term investor, then can I recommend you look at relatively well-developed Asian economies such as South Korea and Taiwan. Both of these countries are home to a number of world-leading industrial and technology companies, including Samsung, LG and Hyundai, to mention but a few. They also do not have economies that are vulnerable to pressures on external debt funding. You can see from the chart below that the South Korean KOSPI index has started to bounce after a slump from the start of December (Figure 2). 

2. The South Korean KOSPI Index Stars to Rebound


So where are the best opportunities right now? I thought I would form my own model portfolio of exchange-traded funds (ETFs) and investment trusts, that I feel are best-placed to gain ground over the next few months. 

NEW! The Idle Investor’s Model ETF & IT Portfolio

The table below details the 6 UK-listed ETFs and investment trusts (3 of each) that I favour at the moment. There are a number of other ETFs and closed-end funds that I am keen on in the US, but have not included here for reasons of simplicity.


Company                           Code Price (Fri)

iShares MSCI UK Small-Cap ETF    CUKS.L    15,027p
Source GLG/Man Europe Plus ETF   MPFE.L      10,999p
iShares Japan GBP-Hedged ETF     IJPH.L        4151p
Invesco Perp. Enhanced Income IT IPE.L          73p
Fidelity Asian Values IT          FAS.L         198p
Herald IT                         HRI.L         715p


A few notes on each fund:

CUKS.L (UK Small-Cap Stocks) – I am very enthusiastic about UK mid- and small-cap exposure, which held up much better than the FTSE 100 in the recent correction, and which should benefit more than their larger compatriots from the strength in the UK economy (as the largest companies tend to be more global in focus). This iShares MSCI UK Small-Cap ETF is a good way to buy exposure to this UK investment style relatively cheaply, without going to all the effort of buying a basket of individual small-cap stocks.

MPFE.L (European Stocks) – This Source ETF is an interesting twist on a European stock fund, as it combines the best stock picks from investment banks in a single fund. Historically, this ETF has outperformed the broad European stock market by around 2% per year, so the model clearly seems to work in adding performance.

IJPH.L (Japanese stock market, hedged) – This iShares Japan ETF is a way to invest in Japan without taking Japanese yen currency risk. After all, one of the reasons that Japanese companies like Toyota are growing their profits is the competitive advantage conferred on these exporters by a weaker currency. However, that is not such good news for an investor based in a currency other than the yen, as then their yen-based assets tend to depreciate. This fund neatly sidesteps the problem by hedging the yen each month back into sterling. 

IPE.L (European Corporate Bonds) – the Invesco Perpetual Enhanced Income Trust is an investment trust that invests in UK & European corporate bonds, and through application of 25% gearing, offers a dividend yield not far off 7% at present. Rare to see such a high yield these days…

FAS.L (Asian Stocks) – The Fidelity Asian Values Trust is an Asia-focused investment trust that is heavily weighted towards South Korea, Hong Kong and China, and which trades at a 12% discount to net asset value following the recent emerging markets rout.

HRI.L (UK Small-Cap Technology & Media) – The Herald Investment Trust is a specialist investor in UK small-cap technology, media and telecoms stocks. Historic performance has been strong, it is invested in both sectors and the size style (smaller companies) that I prefer, and also trades at a 12% discount to net asset value. 

So there you have it, 6 of my current UK-listed fund favourites, all in one portfolio. These can be used by an idle investor to invest in a relatively well-diversified set of assets, without the need to delve into choosing individual stocks, and all achieved at low management charges. 

I will track the performance of this portfolio over the weeks that follow, so we shall see if it is an inspired set of choices or not!

This Week’s Articles, In Case You Missed Them…

I wrote an article on the UK Construction sector in my MindfulMoney Expert Opinion column this week:

1. UK Building Is All Systems Go! If ever anyone needed confirmation that the UK building industry is enjoying the best of times, you only need cast your eyes over the recent UK Construction Confidence survey from the firm Markit, that was released this morning, which hit a new high at nearly 65. Which stocks should benefit from this strength in building? Click on the article to find out…

There have also been a couple of videos you can watch:

2. CNBC TV Guest Host: Why I still prefer Insurance to Banks.... I was asked what I thought about European Banks in the wake of the announcement of Credit Suisse's results - I maintained that I still prefer Insurance companies to Banks. To find out why, please click on the CNBC TV web link below to watch the video…

3. Bloomberg TV Interview: On Emerging Markets, the allure of Technology The topics of this 5-minute interview were the value that can be found today in Emerging markets and European stock markets, following the current correction, and my continuing fondness for the Technology sector.

And if you would like to see and listen to my slideshow presentation with audio commentary on why further monetary stimulus efforts from the European Central Bank are key to the investment case for the European stock markets, click on the video link below:


Have a great week ahead, and please don’t hesitate to recommend this newsletter to anyone who you know may be interested: to subscribe, please just email me at

idleinvestor@idleinvestor.com

The best of luck for the week ahead,
Edmund

Friday, 31 January 2014

The Idle Investor Weekly Newsletter: 31 Jan 2014

Market Outlook:
Just When You Thought All Was Plain Sailing…

After what has turned out to be a rather decent 2013 for those who dared to invest in the stock market, the last couple of weeks in January have stood in stark contrast, a bit of a horror show that has seen the FTSE-100 index (UKX) drop over 300 points. 


But let’s not panic just yet. Yes, a number of emerging markets such as Turkey and Russia have revealed their structural flaws, but at the same time, economic growth is picking up both in the US and in Europe. So the news is certainly not all bad!
For small-cap investors, the picture actually looks rather more cheery. Despite a similar pullback since the middle of this month, the uptrend in the FTSE Small-Cap index (SMX) remains very much intact, with a large number of small-cap stocks that I watch closely breaking out to new price highs.


Remember: normally momentum is persistent. Another way to say this is that in stock markets, what goes up often just continues to go up, particularly after making new highs! So, for those who are interested, here is a non-exhaustive list of those small-caps on my personal radar screen that have broken out to new recent share price highs:


As always, before investing in any of these stocks, please remember that there is no substitute for doing your own research!

Put the correction in context!

Just remember that 2013 was a monster year for stock markets, particularly for the US, and that nothing can go up forever, at least not without taking a breather every now and then. To put things in context, this current correction is nothing like as bad as what we saw in the middle of last year, and yet stocks went on to regain all their losses and a lot more by the end of the year.

And remember, there are not many attractive places left to put your long-term savings. Cash deposits yield even less than ever before, you will be lucky to get a 2%+ rate on deposit accounts these days (I find the Nationwide Building Society one of the best in this respect, once you have exhausted the very limited Regular Saver accounts at the likes of Lloyds, HSBC and First Direct which offer 5% or 6% interest rates on limited amounts). 

Bond yields have come down again, so lending your money to the UK government is not very attractive – you get 1.6% BEFORE tax if you buy a 5-year gilt. You may prefer a bricks-and-mortar investment, with house prices on the rise and even getting quite overheated in London (I should know, I am looking myself!). Unfortunately, thanks to the government’s Help to Buy schemes, London property is literally flying off estate agents’ shelves – I contacted three estate agents in the middle of the week with a view to viewing 8 properties that were for sale, only to be informed that each one had already been sold or gone under offer. House prices are rising much faster than rents, with the result that effective rental yields for buy-to-let investments are falling fast, making them less attractive. 

At the end of the day, I think it is too early to throw in the towel on stocks and shares. In Europe, they continue to provide good value and in general a decent yield, ahead of what one can get from government bonds or cash deposits. This is perhaps less true in the United States, but even there there are still pockets of value, for instance in the large-cap technology stocks like Microsoft and Cisco. 

This Weeks’ Articles, In Case You Missed Them…

I wrote a couple of articles in my MindfulMoney Expert Opinion column this week:

1. RBS reminds me why I prefer Insurers to Banks: the awful results from RBS this week, with massive provisions yet again for a number of mis-selling scandals, highlight why I remain cautious on the Banks sector, and instead prefer to invest in Insurers, particularly in the closed life fund subsector, with names such as Chesnara, Resolution and Phoenix Group on my watch list. 

2. Are Global Markets At a Turning Point? As I have explained above in the Market Outlook, I think it is too early to say that the bull market in stocks is over, and in this article I have included a number of charts to support my optimistic viewpoint.

There have also been a couple of videos you can watch:

3. Investment Ideas for 2014 Which does what it says on the tin…

4. What Does the Recent Market Volatility Mean? This is a slide show with audio commentary, leading you though the key charts and conclusions to draw following this recent emerging markets-led sell-off.

Have a great week ahead, and please don’t hesitate to recommend this newsletter to anyone who you know may be interested: to subscribe, please just email me at edmundshing1@gmail.com

Signing off for now,
Edmund


Friday, 13 December 2013

Investment Theme: Can Retail Investors Fuel A Further Stock Market Rise?

US retail investors have been favouring stocks over bonds for the last few months, with UK investors similarly bullish on stocks. Continental Europe is a different story, however, with investors there much more cautious and only switching out of cash into bonds. 

But given the trends of the last few years, this rotation out of bonds into stocks could go a lot further yet...

Please click on the link below to read the full article:

Investment Theme: Can Retail Investors Fuel A Further Stock Market Rise?

Key conclusions: Favour the European and Japanese stock markets!

Edmund

Wednesday, 4 December 2013

Weekly Global Strategy Screencast: Where are the Financial Markets Headed?

Where are the Financial Markets Headed?December 2013 

This week, I have recorded a screencast of my monthly presentation looking at where my essential financial market indicators are pointed (stock markets, credit markets, financial risk, fund flows etc.). 

Please click on the Youtube link below to watch my 4:30 minute slide presentation with audio commentary (best viewed in fullscreen mode):


Alternatively, you can click on the video below if you don't mind watching the video in a smaller window:


Punchline: Most of my indicators remain positive for risk markets including stock markets for this month.

Happy watching!

Edmund

Thursday, 28 November 2013

Wednesday, 20 November 2013

Global Financial Market Trends - Animated Slideshow with Audio Commentary

For my views on key global financial trends, watch this 4-minute video clip, which goes through a short slideshow of key market charts, together with an audio commentary.


I hope you find this helpful,
Edmund

Tuesday, 29 October 2013

Dividend funds: caveat emptor!

Market Indicators Remain Positive

With the US S&P 500 stock index hitting new highs, we might ask ourselves if shares are finally starting to become expensive, and vulnerable to a near-term correction. Checking a number of my favourite market indicators, conditions look to remain favourable for stocks and shares. 

1. US advance-decline indicator hits new highs

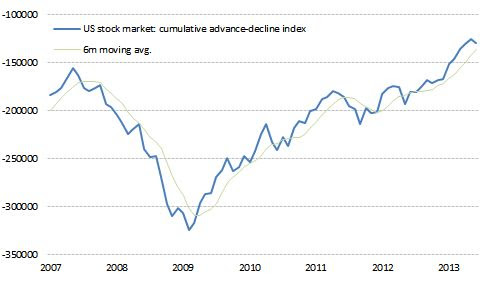
The cumulative advance-decline indicator, that measures how many stocks have gone up versus those that have gone down each day and adds the up-down balance up over time, continues to make new highs. This points to good market breadth, i.e. that the market is being driven by a large number of stocks rising. If this were not to reflect a similar pattern to that for the benchmark stock indices, then I would be concerned. But no worries here...

US Advance-Decline Index Remains very Bullish

 2. US Value Line Geometric Index Also Very Strong

A second measure of market breadth is the Value Line index, which looks at the performance of the average stock in the US. Again, if this were not to be making new highs at the same time as the benchmark stock indices, I would be concerned. But once again, things look good...
US Value Line Index Also In A Bull Trend

3. European Industrial, Bank Stocks Still Performing Well

In an economic recovery scenario, both industrial and financial stocks should perform well, reflecting the benefit of a stronger underlying economy for profits in both these cyclical sectors. Looking below, we can see that European Industrial (SXNP) and Bank (SX7P) sectors are still in strong uptrends, and close to new highs. 

European Industrials, Banks Close to New Highs

But High Quality Dividend Stocks Now Expensive In the US

Interestingly, stable dividend stocks have in particular started to become expensive as investors have looked for yields outside of the traditional bonds and cash sources, given the very low rates of interest currently on offer from both asset classes. 


US Dividend Aristocrat Dividend Yield at record low
The chart above represents the US dividend aristocrat ETF, which only holds US large-cap companies that have raised their annual dividend consistently each year over the last 25+ years. Members include healthcare companies like Johnson & Johnson, and consumer staple companies like Coca-Cola.  All very high quality companies, but now increasingly expensive, only offering a 1.8% dividend yield now as opposed to nearly 2.5% at mid-year. Clearly investors are looking for a better yield than they can get on bonds or cash, but without taking big risks and thus preferring to invest in companies that offer relative stability. 


Focus more on Small-Cap stocks

October has been a pretty good month for Small-Cap stocks, with both UK and US small-cap indices continuing to outperform the large-cap benchmarks and rising in a strong, steady pattern. Both small-cap indices have gained nearly 5% over the last month, continuing to forge new all-time highs. 

UK, US Small-Cap Indices In Steady Uptrend

Favour Industrials, Small-caps; Beware Overvalued Dividends

I remain a big fan of ETFs exposed to small-cap stocks such as the iShares MSCI UK Small-Cap ETF (CUKS) and the iShares S&P Small-Cap 600 ETF (ISP6). You could get exposure to Small-Cap stocks in Europe overall via the db x-trackers MSCI Europe Small-Cap ETF (XXSC). With capital expenditure trends improving, European Industrials also remain a good area for investment at this moment: db x-trackers STOXX 600 Industrial Goods ETF (XSNR). 

But I would be wary of continuing to chase large-cap dividend stocks and indices higher at this point, as many of these stable growth stocks are now sitting at relatively expensive valuations, particularly in the US.  

If you want to buy exposure to European dividends, it would perhaps be better to look at a high-yielding sector ETF that is performing well, such as the STOXX Europe Telecoms ETF (offered by db x-trackers, Lyxor amongst others) rather than chasing what seems to me to be expensive dividend growth, at this point.  

Friday, 28 June 2013

Surprisingly, Market Trend Indicators Still Largely Positive!

28/06/2013

Why I have not (yet) given up on stock markets for now

At times of volatility such as we have recently undergone, I find it helpful to consult a number of market trend indicators that have served me well in the past, and which have a relatively good track record in marking major trends in stock markets, plus potential turning points. 

I have three such indicators that I favour:

1.  The Cumulative advance-decline indicator (The balance between how many US stocks have advanced during a given day, minus how many stocks have fallen, added up day by day from early 1965).

2. The New 52-week highs-lows indicator (The balance between how many US stocks have hit a new 52-week stock price high, minus how many have hit a new 52-week low in a given day, added up from start in 2003). 

3. The High Beta/ Low Volatility oscillator (The S&P 500 High Beta index divided by the S&P 500 Low Volatility index), looking at this oscillator index versus its own 3-month moving average. 

In each case, if the indicator is above its own moving average, then it gives a positive signal for stocks, if below then it gives a negative signal (meaning you should prefer bonds or cash to stocks). 

What do these three indicators flag up as of yesterday?

1. Advance-Decline: Still Positive for Stocks

2. New Highs/New Lows: Also Still Positive for Stocks


3. High Beta/Low Vol: Still Thumbs up for Stocks
Source: Unicorn, S&P Dow Jones Indices


Conclusion: Despite the rocky ride in stocks, bonds and even precious metals over the last few weeks, the current uptrend in stock markets does not look to be over just yet, at least according to these three trend indicators. 

Which sectors to prefer?


The four European stock market sectors still showing good relative strength (i.e. which are still outperforming the overall stock market) remain:

1. Healthcare (e.g. Roche, Sanofi)
2. Technology (e.g. Nokia, Alcatel)
3. Media (e.g. ProSieben Sat1, )
4. Insurance (e.g. Aviva, Delta Lloyd)

However I would be very wary of sectors which have les the stock market lower over the last few weeks, including:

1. Utilities (particularly electricity-related stocks)
2. Oil & Gas
3. Mining
4. Banks

Regional Preferences: Italy and Spain look vulnerable

And on a regional front, peripheral Europe is once again underperforming as their bond spreads over core Europe widen out once again, so be careful of:

1. Italy
2. Spain

On the other hand, Ireland continues to show impressive stock market outperformance, so I would stay with Irish stocks such as Ryanair and Greencore.