Showing posts with label Yield. Show all posts

Friday, 20 February 2015

Lancashire Holding (LRE.L) – A Hot Pot Yield!

Who’s next in the Lloyds insurance serial takeover saga? First Catlin Insurance (CGL.L) is acquired by US reinsurer XL for over 700p per share, then last week Brit Insurance (BRIT.L) accepts a bid from Canadian insurer Fairfax Financial for over 300p per share (post dividend payment), both handsome premia to the pre-bid share price! 

Clearly the global catastrophe insurance market is consolidating fast, as besides these two acquisitions, there have already been two other deals in the US reinsurance sector (RenaissanceRe buying Platinum Underwriters, and Axis Holding merging with PartnerRe).

1. Catlin and BRIT have been kind to their shareholders


Source: Bigcharts.com

Of the big five listed Lloyds insurers, that leaves only Beazley (BEZ.L), Novae (NVA.L) and Lancashire Holdings (LRE.L). According to Bloomberg, bid speculation is already swirling around both Lancashire and Novae. Of these three, I am focusing on Lancashire as an attractive investment for a number of reasons, including its status as a potential takeover target.

What exactly does Lancashire do?

But first, a little background on this stock: Lancashire Holding is a Lloyds insurer that offers global specialty insurance and reinsurance products, principally in the fields of Property, Energy, Marine and Aviation. Its two main property reinsurance products include retrocession written on either a single territory or worldwide basis, and catastrophe excess of loss. 

3 Reasons to Like Lancashire: Takeover Target, Pumped-Up Profitability, Dishy Dividend

First of all, catastrophe reinsurance (where insurance companies like Aviva pay specialist reinsurance companies like Lancashire) is very profitable - after all, this is why the world’s greatest investor, Warren Buffett, operates in this insurance segment with the General Re subsidiary of his company Berkshire Hathaway. 

The four merger & acquisition deals listed above highlight that this industry is becoming all about economies of scale – i.e. the bigger you are, the more profitable you are as you can demand higher insurance premiums for the risk you take on. In the UK Lloyd’s insurance market, Lancashire, Novae and Beazley all appear to be viable takeover targets.

Impressive Growth Record

Lancashire has posted impressive growth since 2006, underlined by the impressive long-term growth in book value that the company has achieved, a cumulative 375% growth rate over the last 9 years (Figure 2).

2. Impressive Long-Term Growth in Book Value + Dividends Paid

Source: Lancashire Group

Delicious Dividends

At a time when high income investments are becoming increasingly difficult to find, £LRE stands out in the FTSE 350 index with its outstanding 9.1% dividend yield, far ahead of any other UK insurer and indeed, the second-highest dividend yielder out of the entire FTSE 350 index (Figure3).
 

3. One of the Highest Dividend Yields in the FTSE 350

Source: Stockopedia

You might think that such a high dividend yield is unsustainable – but I would argue otherwise, given that it has paid a bumper special dividend in 6 of the last 7 years (2011 the only exception) in addition to the regular dividend.

Recent Results Rate Highly

February 12’s Q4 results were solid, with broker Numis highlighting the $92m pre-tax profit in the quarter beating the consensus $58m expectation by some distance, and Lancashire announcing a 50c special dividend (ex-dividend date: 19 March). This should boost confidence in 2015 forecasts, particularly the 90.6c dividend forecast and the forecast of modest growth in book value.

Cheapest of the Lloyds’ Reinsurers

Finally, Lancashire remains the cheapest of the five listed Lloyds’ insurers, as can be seen from the table below (Figure 4):

4. Lancashire is the cheapest of the Lloyds Insurers

Source: Stockopedia

Don’t Just Take My Word For It, Check Out These other Articles on LRE

I am not the only one to believe that Lancashire is a compelling income story; both noted blogger @chrisoil and also Steve Evans of seekingalpha.com have highlighted the many investment attractions of Lancashire, here, here and here. So by all means check out their well-informed views on Lancashire too!

If you can find a more interesting 9% yielding income stock than Lancashire in the UK market today, then please do let me know! In the meantime, I think that 9% is simply too good to pass up. Get it while you still can!

Edmund

Tuesday, 16 September 2014

UK Housing Becoming a Buyers' Market? Not good for estate agents...

The UK media has not tired of bombarding readers with news stories about the runaway nature of the London property market in particular, and the UK housing market in general, this year. As I have been looking to buy a bolt-hole in London, this strong price momentum has been particularly annoying, with properties literally flying off the shelves soon after being put up for sale.


This trend looks finally to be on the turn, despite continued reports of London seeing 19% price growth in the year to July, according to the Office for National Statistics. 


RICS Survey Points to Big Slowdown

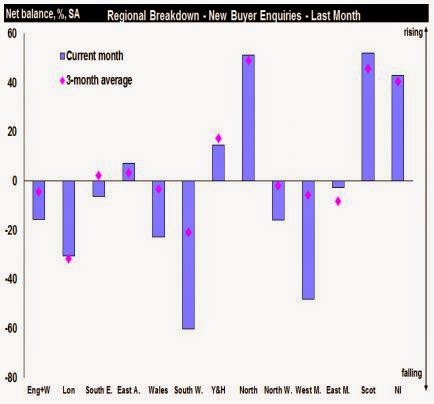
The Royal Institute of Chartered Surveyors' latest monthly survey for August highlights this London slowdown in a number of revealing charts (Figures 1-3):

1. Newly Agreed Sales Are Slowing Fast


2. New Buyers Are Cooling Their Interest Given High Prices


3. Particularly in London

European House Prices Hardly Advance

While UK house prices have gained 12% in the year to July, the latest Knight Frank Global House Price Survey reveals that European house prices overall have only gained 2% over the last 12 months, with certain markets such as Spain still seeing falling prices.  In fact in Europe, only Turkey (+14%) and Ireland (+12.5%) have seen faster house price growth than the UK. But remember, in the case of Ireland, that this rebound in house prices has only come after a terrible 50%+ fall in house prices during the Global Financial Crisis, a far cry from the UK situation today. 

Can we really expect the UK housing market to continue to march upwards, even as affordability ratios deteriorate rapidly and force ever more 20- and 30-year olds live at home for longer in order to try to save up a deposit? And what if the Bank of England decides to begin raising its base rate, even if only gently? This could have a further negative impact on affordability to add to this price growth. 

Seasonal Effects: Q4 is the Weakest Period of the Year for House Prices

I have looked at the quarterly variation in UK house prices from the Nationwide house price index going back to 1952: From this, it is quite clear that Q4 (October-December) is the weakest of the year from the point of view of house price momentum (Figure 4): 

4. Q4 is on Average 0.7% Below Year Average House Price Growth

If we delve deeper and look by month using the Halifax House Price index data back to 1983, we see an even more obvious seasonal effect with August-January registering average house price growth well below the overall long-term average (Figure 5), with a similar if not exactly the same seasonal effect also found in Rightmove monthly asking prices (going back to 2001, Figure 6): 

5. August-January Sees Pronounced Seasonal Weakness in House Prices

6. Rightmove Asking Prices Also See A Weak August-January Trend

Two Conclusions To Reach

  1. With discounts of achieved to asking prices currently widening according to Hometrack, it is time for homebuyers, especially in the pricier London and the South East regions, to be more discerning and to bid lower, particularly if a cash or non-chain buyer and thus able to complete relatively quickly.

  2. Estate agents like Foxtons (FOXT.L) and online property listing websites like Rightmove (RMV.L) and the recently-listed Zoopla (ZPLA.L) should see their premium valuations come under further attack as top-line growth inevitably slows along with overall housing market activity. I see a forward P/E of 22x for Rightmove and 27x for Zoopla as far too high when their core market is slowing, particularly as their dominance and cost to estate agents is spawning rivals like Agents' Mutual. Even estate agents are seeing their percentage-based fee structure under attack from fast-growing online estate agents charging a flat fee (e.g. £500) such as sellmyhome.co.uk. Rightmove and Zoopla could thus be interesting short candidates...

There will be a Time when Estate Agents Are Interesting Stocks

There will inevitably be a time to look at estate agents such as Foxtons and LSL Property Services (LSL.L), but I feel that this will be when they trade on single-digit P/Es and dividend yields of well above 5%. Foxtons may have nearly halved from its post-IPO high but has not hit these valuation levels yet, while LSL is not far away (9.8x forcast P/E and 4.9% dividend yield according to Stockopedia) and may warrant further attention in the months ahead. 

But for the moment, I shall be biding my time and keeping a close eye on house price developments, in the hope of buying either a London property in the months ahead, or at least snapping up the shares of a bargain basement estate agent!

Edmund


Thursday, 11 September 2014

Warm Up on Polar Capital!

Polar Capital: A Good Time To Warm Up

Polar Capital (LON:POLR) is an asset manager, managing a selection of investment trusts (like the Polar Capital Technology Trust, PCT; and the Polar Capital Global Financials Trust, PCFT). They also manage a number of unit trusts and hedge funds, with their Assets Under Management (AUM) up to $13.6bn as of the end of June this year.  

Why I Like Asset Managers

I like asset managers for a number of reasons: 

  1. Firstly, their business model tends to be asset-like, but highly profitable. 
  2. Secondly, as a result of this they are often serial dividend payers and growers, and 
  3. Thirdly, they also tend to hold net cash on their balance sheets, a good buffer to have against periodic stock market and economic downturns. 

They Should Benefit from Financial Repression

We remain mired in a strange economic scenario, where global economic growth is struggling and requires a very helping hand from central banks around the world, in the form of Zero Interest Rate Policies (ZIRPs) and Quantitative Easing (QE) programs. While these ultra-low interest rates have been manna from heaven from borrowers, they have been dreadful news for savers, with UK deposit savings rates falling year on year (Figure 1).

1. UK Deposit Rates Hit a New Historic Low


And yet, scarred no doubt by 2 stock market crashes since the year 2000, the average UK household has preferred to keep a large amount of savings in the form of cash, rather than any other higher-yielding investments like stocks and shares. This is a global trend; In the US and Germany, for example, cash held on deposit by households continues to hit new highs at over 0.4% of GDP (red line and right-hand scale on Figure 2), in spite of the five-year old stock market rally and the US S&P 500 index recently breaching the 2000 level. 

2. US Savers Keep Record Amounts in Cash


As these ultra-low interest rates on cash deposits remain, there will be added pressure over time on households to find better yields elsewhere, in other asset classes like stocks and bonds.

Right Now, Stocks Yield the Most

The Hunt for Yield should push investors towards stocks, given the already-depressed yields now available on government bonds; note that you now have to pay the German government in effect for them to keep your money for 1 year (Figure 3)! While the FTSE 100 index is due to pay out 3.7% this year...

3. Stocks Yield More than Bonds or Cash


So for asset managers like Polar Capital (LON:POLR) who specialise in stock-based funds or higher-yielding specialist areas like emerging market bonds, this should ensure positive inflows over the medium-term. 

Polar Capital: High Dividends, Backed By High Profitability and Cash on Balance Sheet

Running Polar Capital by the numbers reveals a number of strengths that attract me to the stock. Firstly, the dividend yield is high at 7.3% on a prospective basis (Figure 4), although Stockopedia registers an even higher 7.9% yield number. these compare very favourably to yields available elsewhere in the higher-yielding Asset Management sector. Moreover, this dividend has grown steadily from 4.5p for March 2010 to a forecast 30.8p for the fiscal year ending March 2015. 

4. US + UK Asset Managers' Dividend Yields


You might be concerned that Polar Capital's dividend cover ratio is only 1.1x, but there are a couple of further positives that should allay these dividend payment fears. 

Profitability, as measured by last year's Return on Equity, are also generally high across the Asset Management sector, with Polar Capital posting a very respectable 23% ROE (Figure 5):

5. US + UK Asset Managers' Return on Equity


Finally, net cash on balance sheets is high across UK asset managers, averaging over 14% across the sector ex Polar Capital, while Polar Capital itself has an even better 24.6% level of net cash on balance sheet as a percentage of current market capitalisation, better than any other major asset manager bar Man (LON:EMG) (Figure 6):

6. UK Asset Managers' Net Cash on Balance Sheet as % of Current Market Cap.


Basic Valuation Also Looks Attractive

Aside from the high dividend yield, bear in mind that the forecast P/E (once cash on balance sheet is substracted) comes out very cheaply at under 9x for March 2015 and an Enterprise Value/EBIT ratio of only 7.3x, while book value growth has been impressive since 2010 too. 

So What's The Catch? Slowing AUM Growth, Stock Market Risk

a. End-June: First Outflow in 15 Quarters 

The latest statement on assets under management as of 30 June revealed that AUM had only grown 3% in the quarter since the end of March, in effect suffering a net outflow for the first time in 15 quarters. This marks a pause in their impressive growth rate, which had seen AUM grow from just $2.5bn in March 2010 to $13.2bn by March of this year (Figure 7):

7. Polar Capital's Impressive AUM Growth Track Record


b. High Stock Market Beta: Great When Stocks Rise, But Painful in a Bear Market 

Clearly, while asset managers tend to see growth in AUM and thus rising profits in a bull market, they are also very sensitive to a bear market, when they tend to under-perform benchmark stock indices like the FTSE 100, as was the case back in 2008 and 2011, when both US asset managers (black line) and UK asset managers (yellow line) suffered greatly (Figure 8):

8. High Market Beta Means Pain During Bear Markets for Asset Managers


With all this in mind, I still find Polar Capital (LON:POLR) very tempting at the current share price of a tad under 430p, resulting in a single-digit ex-cash P/E valuation, particularly given that one is paid to wait by the generous dividend yield. 

Remember that with 32% of Polar's shares held by directors and employees, their interests are very much aligned with other shareholders!

But of course, Do Your Own Research as ever!

Edmund

- See more at: http://www.stockopedia.com/content/warm-up-on-polar-capital-86071/#sthash.uWUExNkc.dpuf

Monday, 7 July 2014

Want High Yield and Momentum? Go for Insurance!

Time to Love Non-Life Insurance

One of the key investment themes that I continue to champion is that of the "Hunt for Yield". Here we are, in a period where global central banks are conspiring to keep short- and long-term interest rates as low as possible in order to shore up what is fragile economic growth in the "New Normal" of a post-crisis Developed World. 

At a time when government bonds, and even investment-grade corporate bonds, are no longer offering anything like attractive yields to maturity, where can income investors turn? One solution is to subscribe to Neil Woodford's new fund, which unsurprisingly is stuffed yet again with AstraZeneca (LON:AZN), GlaxoSmithKline (LON:GSK) and tobacco companies like Reynolds American, as it was back in his old funds at his former employer Invesco Perpetual. 

I prefer a stock-picking approach, focusing on sustainable value and momentum. Within the UK stock market, the sector that looks best placed on these metrics is the UK non-life insurance sector, containing such high yield gems as Brit (LON:BRIT), Amlin (LON:AML) and Catlin (LON:CGL) within the Lloyds of London reinsurance segment, and the RBS spin-off Direct Line Insurance (LON:DLG) in more classic Property & Casualty insurance. 


High and Sustainable/Growing Yields

Each of these four insurers offer prospective dividend yields in excess of 5%, up to 10% in the case of recently refloated Brit (LON:BRIT). 

Dividend payout ratios are of the order of 60% except in the case of Brit (LON:BRIT), and Returns on Equity are typically between 10% and 13% this year and next. All of which suggests that not only are these high dividend yields sustainable (except in the case of a sharp unexpected drop in earnings), but that long-term dividend growth should be in the region of 4-6% going forwards. Perhaps not exceptional, but certainly more than enough to compensate for inflation.  


Value aplenty too

To read the rest of this article, please click on the web link below:


Wednesday, 18 June 2014

Hunting Bond-Beating Income Ideas: Stocks, Funds

With short-term bank deposit accounts now offering well under 2% interest, and even loaning money to the UK government for 10 years (via Gilts) only garnering a meagre 2.7%, a lot of savers and investors will be wondering where they can put their money for a better income stream. 


Look to Corporate bonds?

The first obvious port of call could be sterling investment-grade corporate bonds, which offer a 3.8% yield at present, a 1.8% improvement on the yield offered by UK 5-year gilts (Figure 1).  

1. UK Corporate Bonds Offer 3.8% Yield

Source: Bloomberg

The easiest investment vehicle for this would be an ETF like the Core £ Corporate Bond UCITS ETF (code: SLXX), which charges just 0.2% per year in management fees for this bond exposure and yields 3.5% net of fees. 

What about income funds? 

A second possibility would be an income fund of some description, which could potentially yield as much or more than UK corporate bonds, but which can also include some element of dividend growth going forwards.

 An interesting income proposition in the investment trust world could be the income shares of the JPMorgan Income & Growth investment trust (code: JIGI), which invests in blue-chip income stocks. This split-capital trust is due to wind up at the end of November 2016, at which point investors will receive the net asset value per share of the fund less winding-up costs. 

At the moment, these income shares trade at a 8.4% discount to the final Redemption Price of 103.4p, while offering a generous 4.7% dividend yield. If the NAV was to remain at its current level at wind-up date, then income share investors stand to receive 9.9p in cumulative dividends between now and then, plus another 8.6p from the closing of the gap to the redemption value, i.e. 18.5p in total on a 94.75p share price, or nearly 20% return over the next 2.5 years, roughly an 8% annualised return with good visibility. 

Otherwise, an dividend income-focused ETF like the iShares UK Dividend UCITS ETF (code: IUKD) could be an option, offering a 4.0% dividend yield from a dividend-weighted portfolio of UK large-cap stocks including SSE, Imperial Tobacco and BP.

Both of these fund choices would give you a one-stop equity fund offering a yield above the 3.5% from the UK corporate bond ETF. 

Choosing Bond-Beating Income Stocks

The third option is to make up your own income stock portfolio by choosing a number of high-yielding stocks. If we take the target as a current yield above the corporate bond ETF's 3.5%, and add requirements to favour stocks that should also deliver an above-inflation rate of dividend growth going forwards, then we can create our own "bond-beating" stock portfolio. 

Using www.stockopedia.com's UK stock screening tool, I built my own simple screen looking for UK stocks that yield 3.5% or more, whose dividend is covered by earnings to the tune of at least 1.5x (to leave room for future growth) and which are in the top 30% of Stockopedia's combined StockRanks ranking (which combines Value, Quality and Momentum criteria). 

Here is the list of the Top 25 stocks on the resulting screen, ranked by best combined StockRank:

2. Bond-Beaters UK Screen

Source: www.stockopedia.com

This screen, if replicated as a 25-stock equal-weighted portfolio, would have an average dividend yield of 4.6% and dividend cover of nearly 2x, leaving ample room for profit and dividend growth. 

You may notice that a couple of sectors are well-represented here, including the Insurance (Catlin, Amlin) and Property (UK Commercial Property Trust, New River Retail) sectors, which remain two of my personal favourite UK sectors for the moment given their attractive combination of value and momentum.

Of the names in this list, I would be keen on Amlin (code: AML) given its strong record of profitability and very steady historic dividend growth (more detail here), and also New River Retail (code: NRR) given its low level of net gearing for a property company (18% of equity) and leverage to an improving UK consumer (as real average wage growth turns positive at last). 

Edmund


Wednesday, 21 May 2014

Should investors be shopping for income at Sainsbury?

A tail of woe in the supermarket sector

UK Food Retailers have been battered of late - the main culprits being:


  • The lack of UK households' purchasing power, with inflation consistently running ahead of wage growth;
  • The rise and rise of German food discount chains Aldi and Lidl

This has led to savage drops in share prices in the sector as investors have worried over the resultant combination of increasing price pressures and losses of market share: Tesco (code TSCO.L) has fallen from 378p in September last year to just 302p currently; Wm. Morrison (MRW.L) has slid from 303p back then to just 204p now; and Sainsbury (SBRY.L) has tumbled to 337p today from 410p in November 2013.

Why Sainsbury? Hasn't sales growth been falling?

Analysts will point to slowing like-for-like sales growth (comparing only the sales at stores that have been open at least 1 year) at Sainsbury as a real cause for concern; in the year to March 2014, it is true that Sainsbury only managed yearly like-for-like sales growth of 0.2%, the lowest for 9 years. Overall sales growth slowed to 2.7% in this latest year, again the slowest growth rate recorded since 2004 (Figure 1).

1. Sainsbury See Slowing Growth But Higher Profit Margins

Source: Company reports

But note also from Figure 1 that Sainsbury's overall profitability, as measured by operating profit margins, has continued to rise to 4.2%, a level of profitability not seen since the year 2000! So despite the pressures from the discounters, Sainsbury is managing to squeeze out better profitability year by year, unlike the falling profit margins at Tesco, Morrisons and even Wal-Mart (US owner of Asda).

And retail sales could be getting better...

Moreover, April retail sales in the UK (excluding petrol and diesel sales) posted a surprising jump today of 1.8% over the month of March, and a sizeable 7.7% yearly growth rate when compared with April last year. In fact, retail sales over the last three months are now rising at their fastest rate for a decade! So there may be some relief for supermarkets to come. Indeed, excluding April 2011 (the Royal Wedding), food sales in April rose at the fastest pace since records began in 1988...

There's value to be had

Sainsbury stands up well on a raft of value metrics too: at the current 337p share price, it trades on 11x prospective P/E and a price/book value ratio of 1.0x. So yes there may not be a huge amount of growth to be had at present, but I would suggest that this fact is already more than adequately reflected in these lowly valuation multiples. And yet, Sainsbury's underlying book value per share (an accounting measure of company value) continues to grow steadily (Figure 2) to stand today at 320p, while the net profitability earned on this equity continues to rise, hitting over 12% as of March 2014.

To read the rest of this article and see the remaining charts,
please click on the web link below:


Monday, 28 April 2014

Insuring a growing 6% yield with Amlin

Hunting for yield? Look no further than Amlin!

Want a 6% income that should grow? Like companies with long-term track records of growth and high profitability? Like “value” companies that trade on as P/E of 10x or less?

Then Amlin (code AML.L) is an excellent UK company for you to look at!

Who is Amlin?

Despite the fact that Amlin is a member of the FTSE Mid-250 index and sitting at a market capitalisation of £2.2 billion, you would be forgiven for never having heard of them.

Amlin is an insurance and reinsurance company that operates in Lloyds of London. It provides insurance cover to companies in the following areas: Catastrophe Reinsurance, Marine and Aviation Insurance, Commercial & Domestic Property & Casualty insurance as well as International P&C.

Geographically the company operates globally with main markets being North America, Continental Europe and also the UK.


Three reasons to Like Amlin: 6% Yield, growth record, profitability

First of all, the income – a prospective 6.1% dividend yield for this year based on the current share price of 442p. There is little reason to expect this dividend not to be paid at this level, given that:

The expected dividend of 26.9p is well covered by expected earnings per share of 42.7p;
Amlin has maintained or grown its dividend each year for each of the last 10 years (Figure 1), making it it is what I call a “dividend aristocrat”.


1. AMLIN HAS A STRONG RECORD OF DIVIDEND GROWTH


Source: Bloomberg

So if you like regular and growing income, Amlin is a good choice.

Secondly, long-term growth. Amlin grown its dividend steadily over time by an average of 27% per year since 2003, and is forecast by analysts to grow its total dividend further by 4% both this year and next.


To read the rest of this article and see further charts,
please click on the link below: